Управляя ценностями, лидерством и
изменениями в XXI веке»
(ISBN 978-5-91171-026-2)

SDTEST® has 28 different VUCA polls that calculate the 9,191 correlation values between stages of development according to the theory of Spiral Dynamics and answer options of these 28 polls.
We invite curiosity about the systemic mechanisms behind this correlation. There may be hidden variables that provide alternative explanations.
-0.0526 between Adaptability to change and Purple stage.
The critical value of the correlation coefficient for a normal distribution, by William Sealy Gosset (Student) r = 0.0444. This negative correlation -0.0528 meets the reliability criteria but does not necessarily imply causation.

A key insight around this negative correlation is that the Purple vMeme's strong attachment to ancestral traditions and beliefs could restrict adaptability to change. As the statistical analysis shows, the more one associates with the Purple stage oriented around customary rituals and a tight-knit in-group identity, the less capacity they may have to adapt flexibly.
This makes intrinsic sense - groups guided strictly by "the way things have always been done" will likely resist shifts threatening tribal norms. However, the negative correlation provokes thought around nuances. Perhaps certain aspects of Purple values offer stability amidst change, even while limiting the willingness to reinvent.
Moving forward, we must carefully study how beliefs that "wisdom lies in the past" intersect with progressive adaptation. Under what circumstances might allegiance to tradition severely hamper versus moderately slow, flexible responses to shifting conditions? Are there tipping points where Purple psychology snaps from change-aversion to change-acceptance?
0.0956 between the Influential and the Red stage.
The critical value of the correlation coefficient for a non-normal distribution, by Spearman r = 0.0018. This positive correlation of 0.0956 meets the reliability criteria but does not necessarily imply causation.


Given the Red vMeme's raw exertion of power and competitiveness, this 0.0956 positive correlation makes intrinsic sense. Those viewing the world through a Red lens aim to establish control and prominence through sheer influential force.
The Red psychology is wired to command respect through bold displays of dominance. They lead via raw magnetism and wielding authority. While such strong-arm influence can achieve goals, it overlooks ethics and the greater good.
In studying this further, we should explore the contexts where Red leaders gain followings versus eventual rebellion. Their impulsiveness and desire for immediate results can inspire action yet also sow seeds of uprising if they ignore prudence and care for people.
We must take care not to assume "might make right" even if the capacity for influence correlates at a vMeme level. Not all expressions of power translate into ethical, sustainable leadership. Discernment is required to channel Red psychology toward positive ends rather than coercion through force of personality.
0.0742 between the Financial compensation and the Blue stage.
The critical value of the correlation coefficient for a normal distribution, by William Sealy Gosset (Student) r = 0.0664. This positive correlation of 0.0742 meets the reliability criteria but does not necessarily imply causation.

This positive correlation connects 0.0742 with Blue vMeme's adherence to hierarchy, duty, and moral principle. In aligning with the structure and rules, financial incentivization reinforces one's sense of a meaningful place within the greater order.
Additionally, Blue psychology emphasizes self-sacrifice for the greater good. Higher pay symbolizes the importance of one's ceremonial contribution according to the code. It affirms the significance of one's disciplined efforts for the purpose of the team.
However, taken to an extreme, might strict Blue orderliness become disturbed by growing income inequality? We must ensure that unfair compensation does not breed questioning of the entire bounding system.
-0.1513 between the Empathy and the Orange stage.
The critical value of the correlation coefficient for a normal distribution, by William Sealy Gosset (Student) r = 0.0475. This negative correlation -0.1513 meets the reliability criteria but does not necessarily imply causation.

Given the Orange vMeme's focus on data, logic, and results over social-emotional intelligence, this -0.1513 negative correlation makes sense. Orange psychology risks losing touch with human needs and relational nuance in chasing progress through reason and strategy.
However, the picture may be more complex; purely rational decision-making has limits, and even competitive Orange leaders must consider how to motivate teams. It would be worth exploring whether certain expressions of Orange thinking allow room for empathy's inspirational power.
We must avoid conflating correlation with causation and assuming no form of Orange success integrates empathy. This provocative finding opens the insightful dialogue about social-emotional intelligence, even in the most metric-driven leaders. We welcome additional respectful perspectives!
0.1437 between the Climate change and the Green stage.
The critical value of the correlation coefficient for a normal distribution, by William Sealy Gosset (Student) r = 0.055. This positive correlation of 0.1437 meets the reliability criteria but does not necessarily imply causation.

The critical value of the correlation coefficient for a normal distribution, by William Sealy Gosset (Student) r = 0.055. This positive correlation of 0.1437 meets the reliability criteria but does not necessarily imply causation.
This positive correlation of 0.1437 connects deeply with the Green value system's emphasis on ecological sustainability and harmony between humanity and nature. Seeing existence through a Green lens involves treasuring the interconnectedness of all living systems.
From this perspective, climate crisis threatens the web of life itself. Green psychology recoils at the authoritarian mindsets that would exploit ecosystems for short-term gains. So action on climate change aligns with cherished Green ideals of principle over profit, future generations over present greed.
As we analyze this climate-concern correlation further, we must examine the nuances in how Green psychology mobilizes, blocks, or hesitates in response to ecological threats.
We talked about this poll in more detail in this article.
-0.0797 between the Reduced salaries and the Yellow stage.
The critical value of the correlation coefficient for a normal distribution, by William Sealy Gosset (Student) r = 0.0773. This negative correlation of -0.0797 meets the reliability criteria but does not necessarily imply causation.

This negative correlation of -0.0797 suggests that those embodying Yellow psychology resist reactive salary cuts amidst crises. Rather than seeing employees as expenses to trim, Yellow perspectives value the development of human capital intrinsically.
In integrating multiple worldviews, Yellow Thinking understands how corporate environments impact well-being across interconnected systems. Cutting wages without examining root issues seems like an outdated command-and-control lever.
Overall, the correlation suggests that Yellow humanism outpaces checks on idealism. By seeking hidden growth opportunities within constraints, an advanced integrator mindset may find “both/and” solutions, sidestepping tradeoffs. But continual self-critique ensures a higher purpose, not just optimism, fuels its decisions.
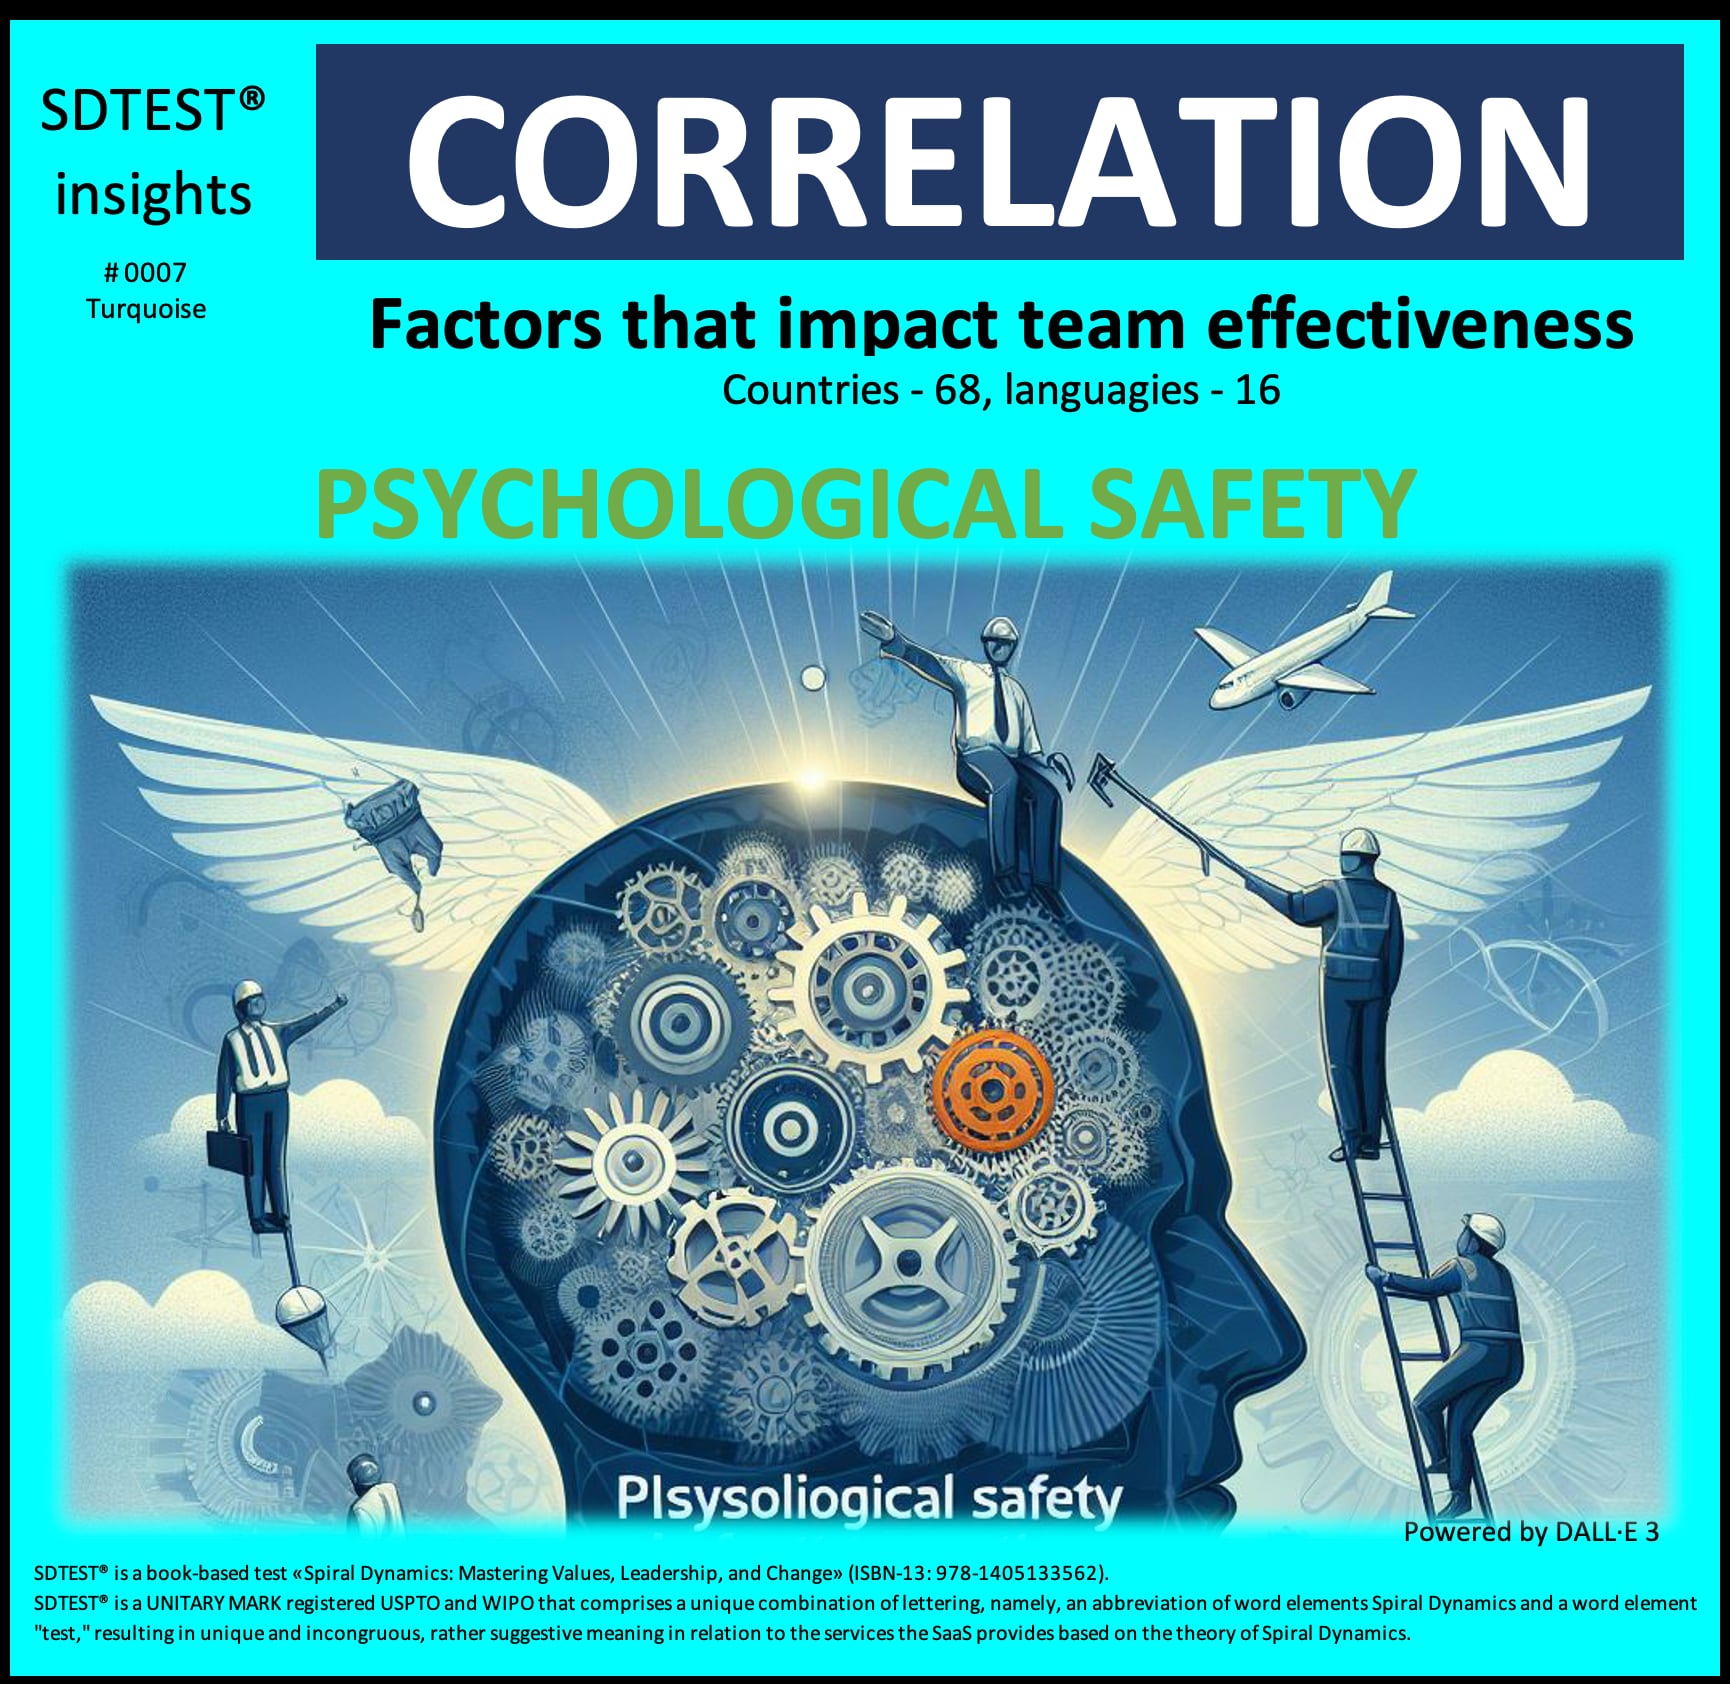
0.0663 between the Psychological safety and Turquoise stage.
The critical value of the correlation coefficient for a normal distribution, by William Sealy Gosset (Student) r = 0.0627. This positive correlation of 0.0663 meets the reliability criteria but does not necessarily imply causation.

This positive correlation of 0.0663 resonates with the Turquoise value system's orientation toward interconnectivity, empathy, and inclusion. Seeing existence through a lens of holism, Turquoise psychology recognizes how emotional safety enables vulnerability, creativity, and belonging.
From farming communal practices to indigenous council circles, Turquoise models integrate psychological safety as crucial for cooperation.
Yet, Turquoise thinkers also understand complexity within human systems. Kindness alone cannot surmount all barriers between diverse perspectives or histories.
What insights do you gain from today's correlation? How might we study this relationship more carefully before deducing causation? We welcome respectful and wise perspectives!
Stay tuned every week as we share more results and insights.
After login or registration, free access to the poll results in the FAQ section.
