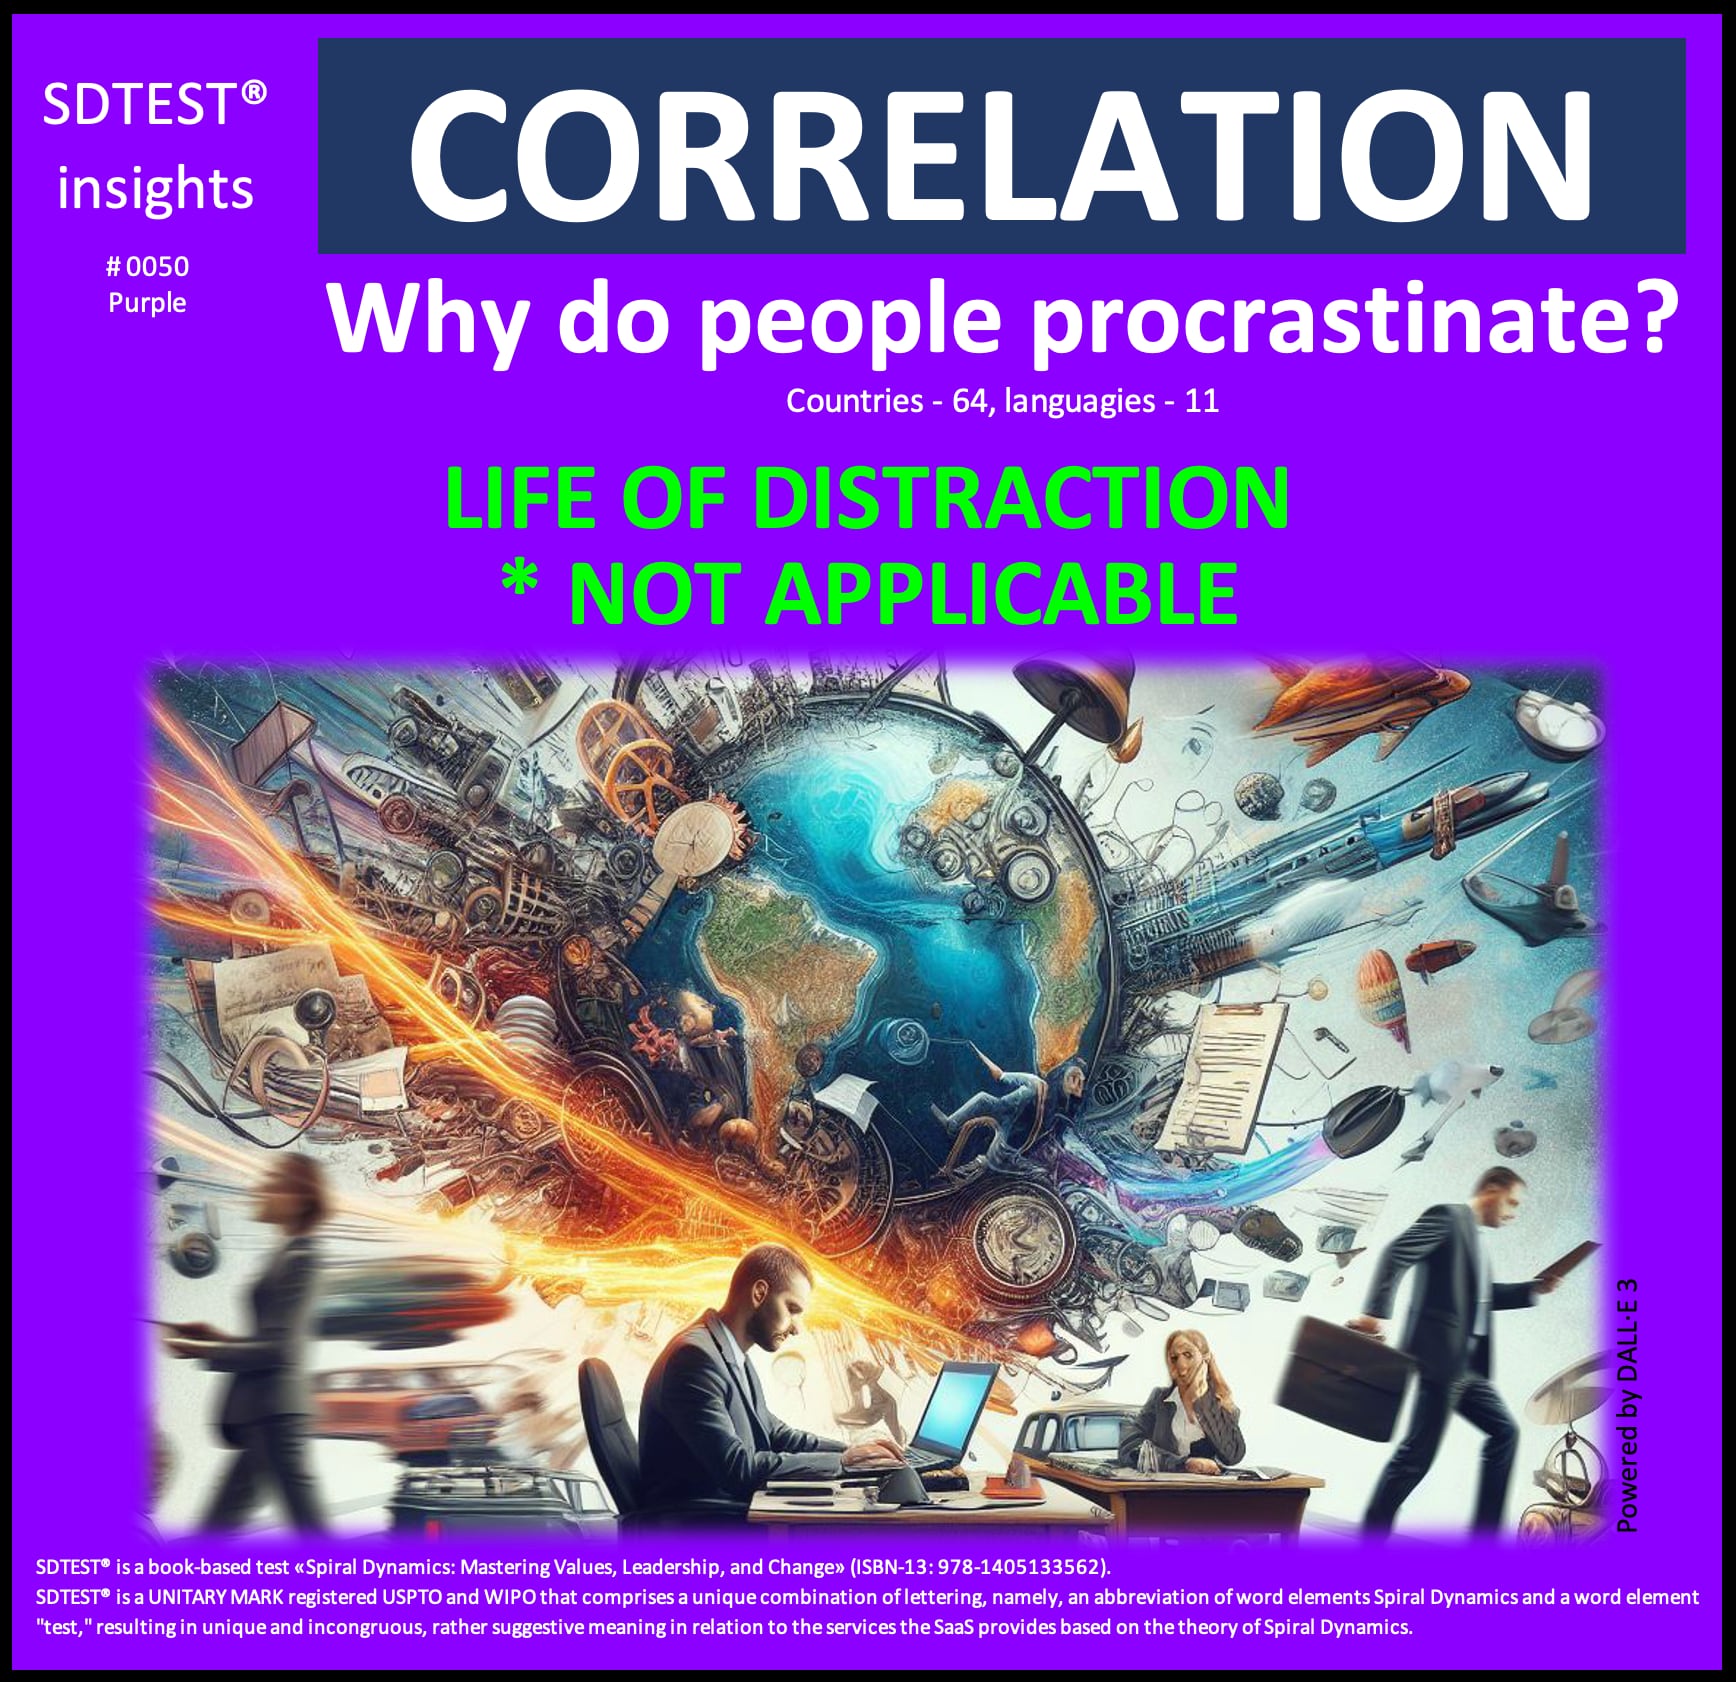
This positive correlation of 0.1038 makes sense, given Purple's grounding in ritual, tradition, and established social rhythms. Deviating from embedded routines threatens stability in tight-knit communities governed by spiritual customs and elder wisdom.
Interruptions or distractions that divert focus disrupt the magical bonds and folklore preserving order across generations. They also demonstrate impatience with the elegant natural cycles and destiny defining one’s ordained path. Respecting rhythms enables collective survival.
Additionally, with authority and expectations for contribution clear, there is little uncertainty around tasks. Social roles provide direction even without rigid schedules. And leisure is built into ceremonies and seasons, not snatched anxiously between obligations.
In short, from Purple, there is trust in the time-honored pace of duties flowing from mystical sources. Distraction contradicts sacred destiny. By rejecting this concept outright, Purple affirms faith in grace emerging from staying loyal to routine—without modern fragmentedness.
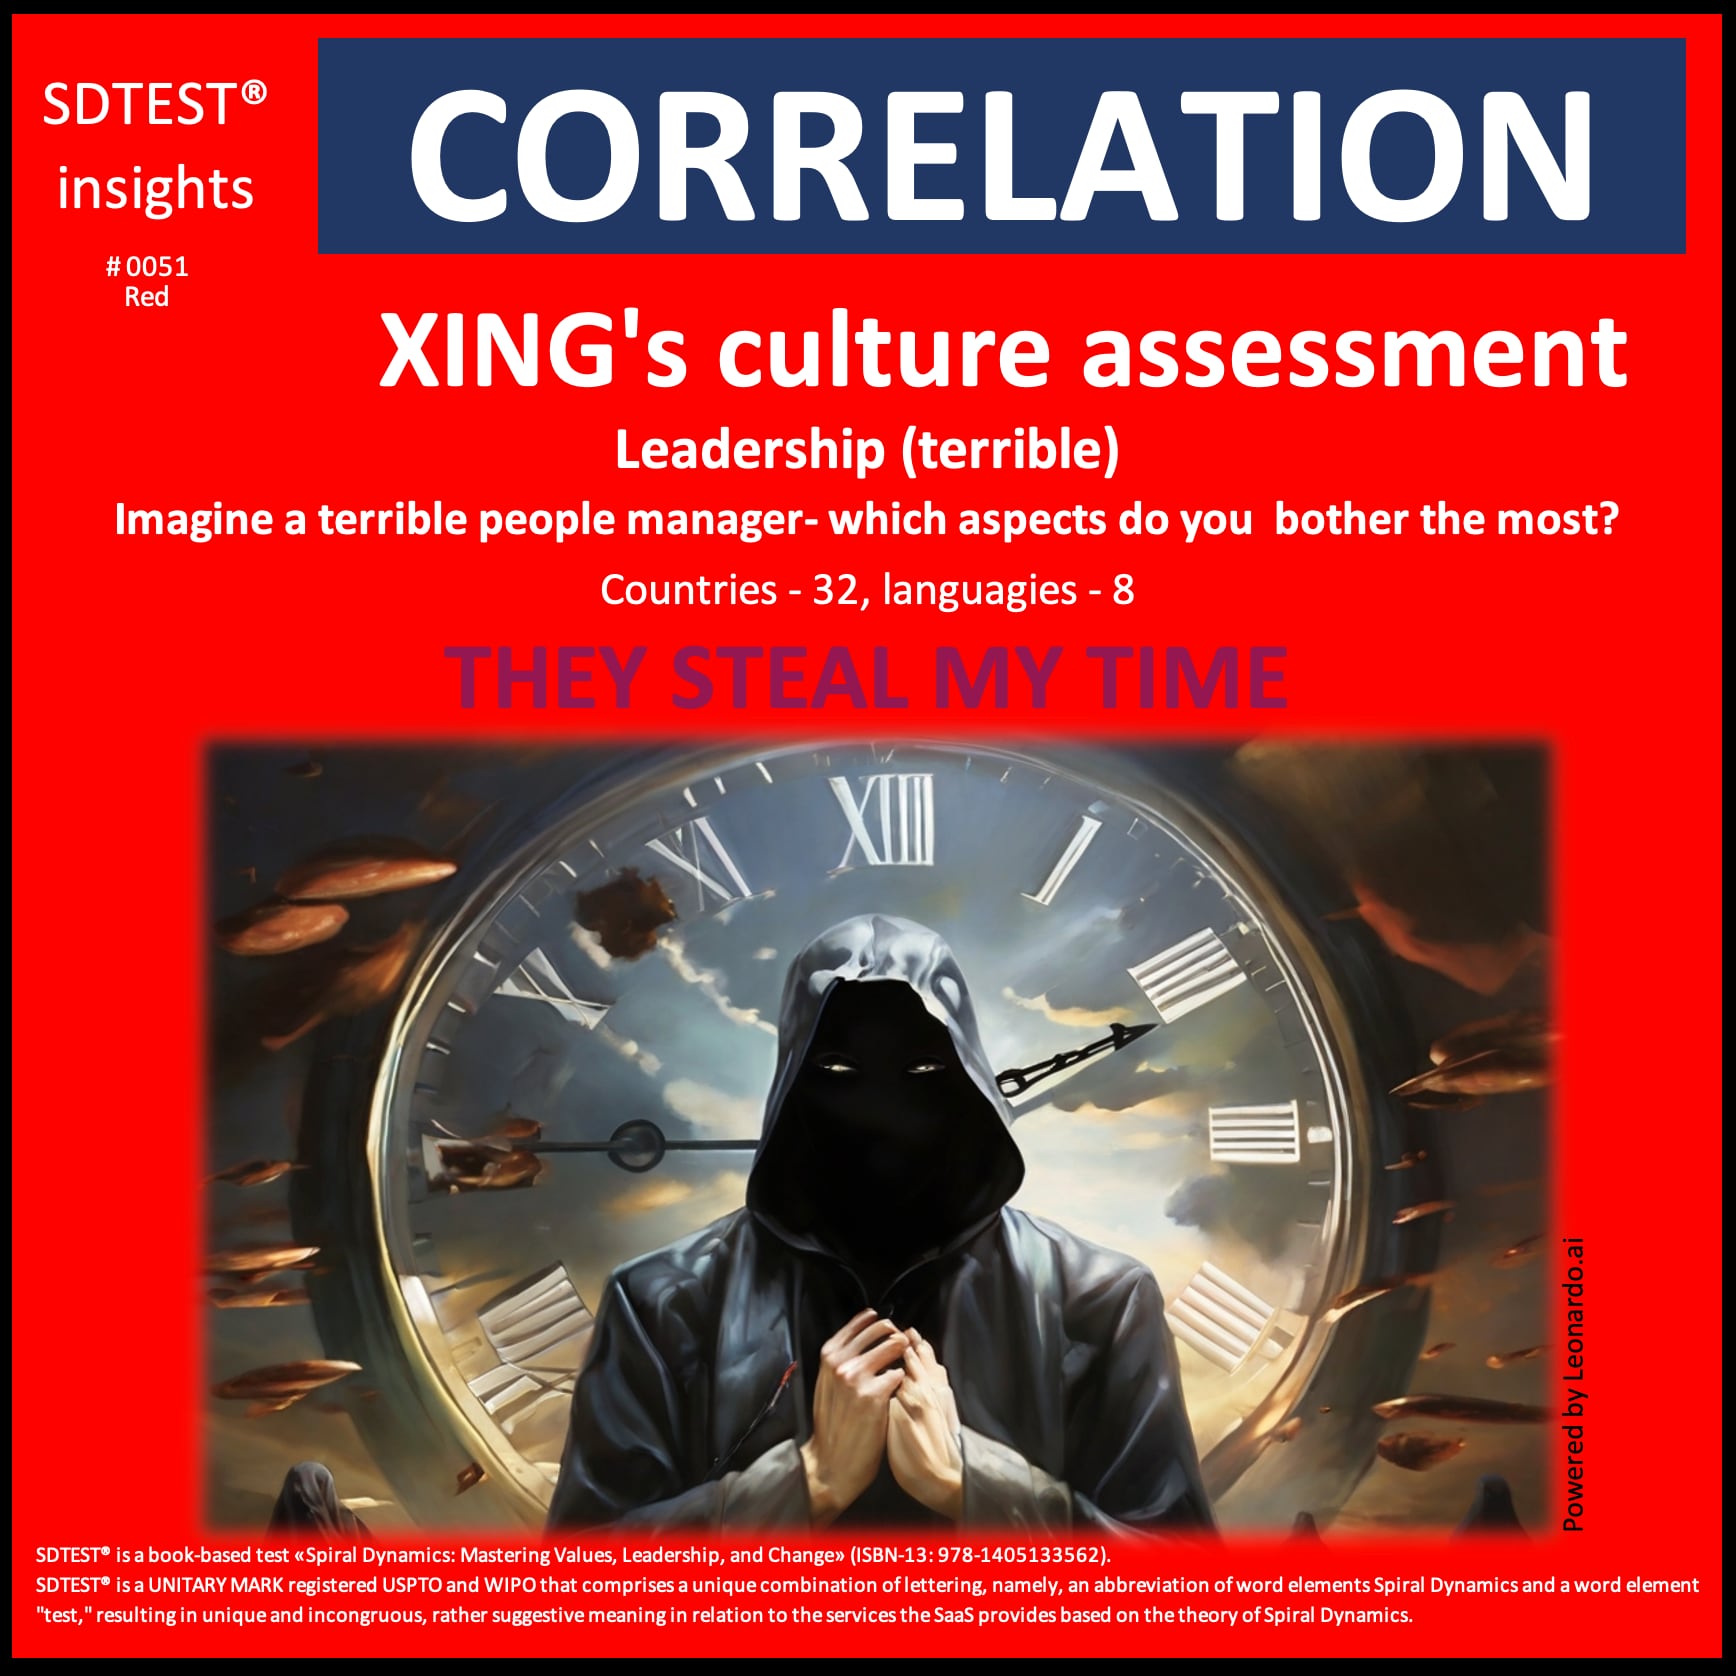
This negative correlation of -0.2032 indicates that those identifying with the Red vMeme are *less likely* to be bothered by a terrible manager stealing their time.
In other words, the more someone resonates with Red values of power and action orientation, the less bothersome they would find a demanding boss taking up their time. They would be less inclined to see time theft by leadership as an intolerable offense.
This aligns with Red's go-getter mindset focused on overcoming obstacles through sheer self-reliant grit. Rather than play victim to unreasonable superiors, Red would tap into personal agency to skirt burdensome barriers from above. Their independence refuses to be relentlessly controlled or drained.
So, Red self-sufficiency corresponds with not rating time theft by terrible managers as deeply troubling. They circumvent restraints through ingenuity and relentlessness. This negative correlation reflects Red's stubborn resilience against all odds.
In our analysis of the poll "Empathy is," we found an intriguing positive correlation that warrants closer examination:
0.0957 between the Seeing things from another point of view / Strongly Disagree and Blue stage.
The critical value of the correlation coefficient for a normal distribution, by William Sealy Gosset (Student) r = 0.0862. This positive correlation of 0.0957 meets the reliability criteria but does not necessarily imply causation.
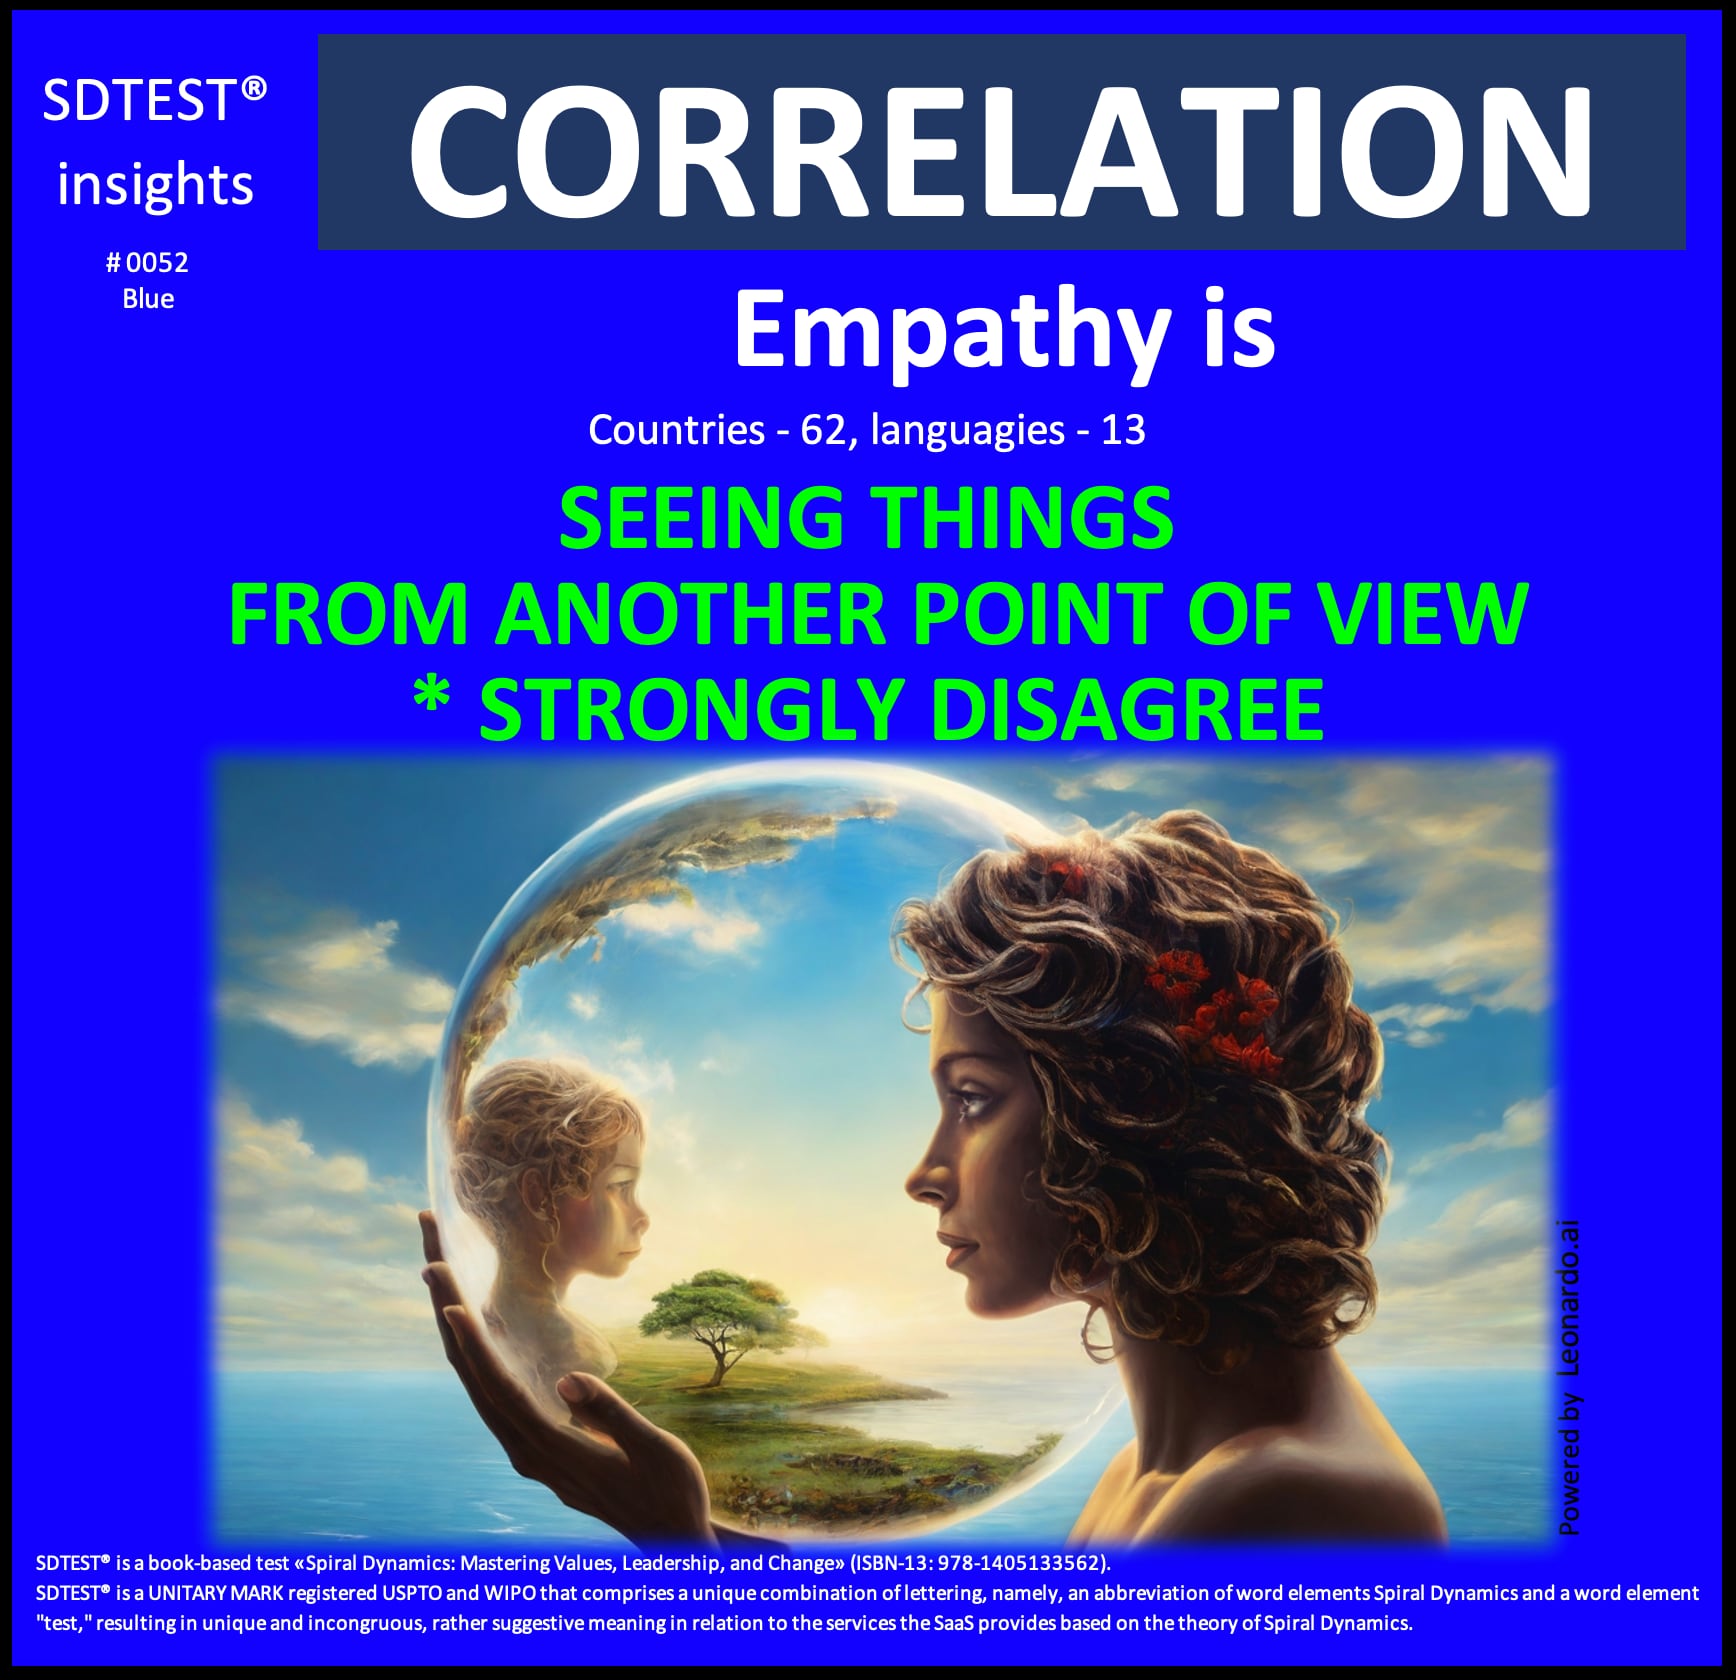
This positive correlation of 0.0957 makes sense, given Blue's adherence to established order and traditional authority. In the Blue worldview, truth and proper codes of conduct have already been defined by powers above questioning.
Seeing other points of view risks moral relativism that violates adherence to righteous structure. It allows chaos, doubt, and sinful urges to undermine clarity guardrails upholding the sacred social order.
From authoritarian Blue logic, understanding others' contexts often enables unvirtuous mindsets. It departs from deference to the wisdom of elders who have already determined absolute rights and wrongs to preserve stability.
Additionally, Blue utilizes discipline and punishment to deal with those who stray outside conformity. Empathy for rule-breakers signals weakness, threatening Blue ideals around justice, loyalty, and duty.
In sum, the data suggests Blue strongly favors conformity over contextual flexibility. Adhering closely to sanctified top-down rules ensures salvation and continuity, while empathy erodes the walls protecting timeless truth from secular second guessing.
In our analysis of the poll "The Five Dysfunctions of a Team (Patrick Lencioni)," we found an intriguing positive correlation that warrants closer examination:
0.1706 between the Avoidance of Accountability (Holding peers accountable is necessary for team success. Avoidance can lead to declining standards) and the Orange stage.
The critical value of the correlation coefficient for a normal distribution, by William Sealy Gosset (Student) r = 0.1424. This positive correlation of 0.1706 meets the reliability criteria but does not necessarily imply causation.
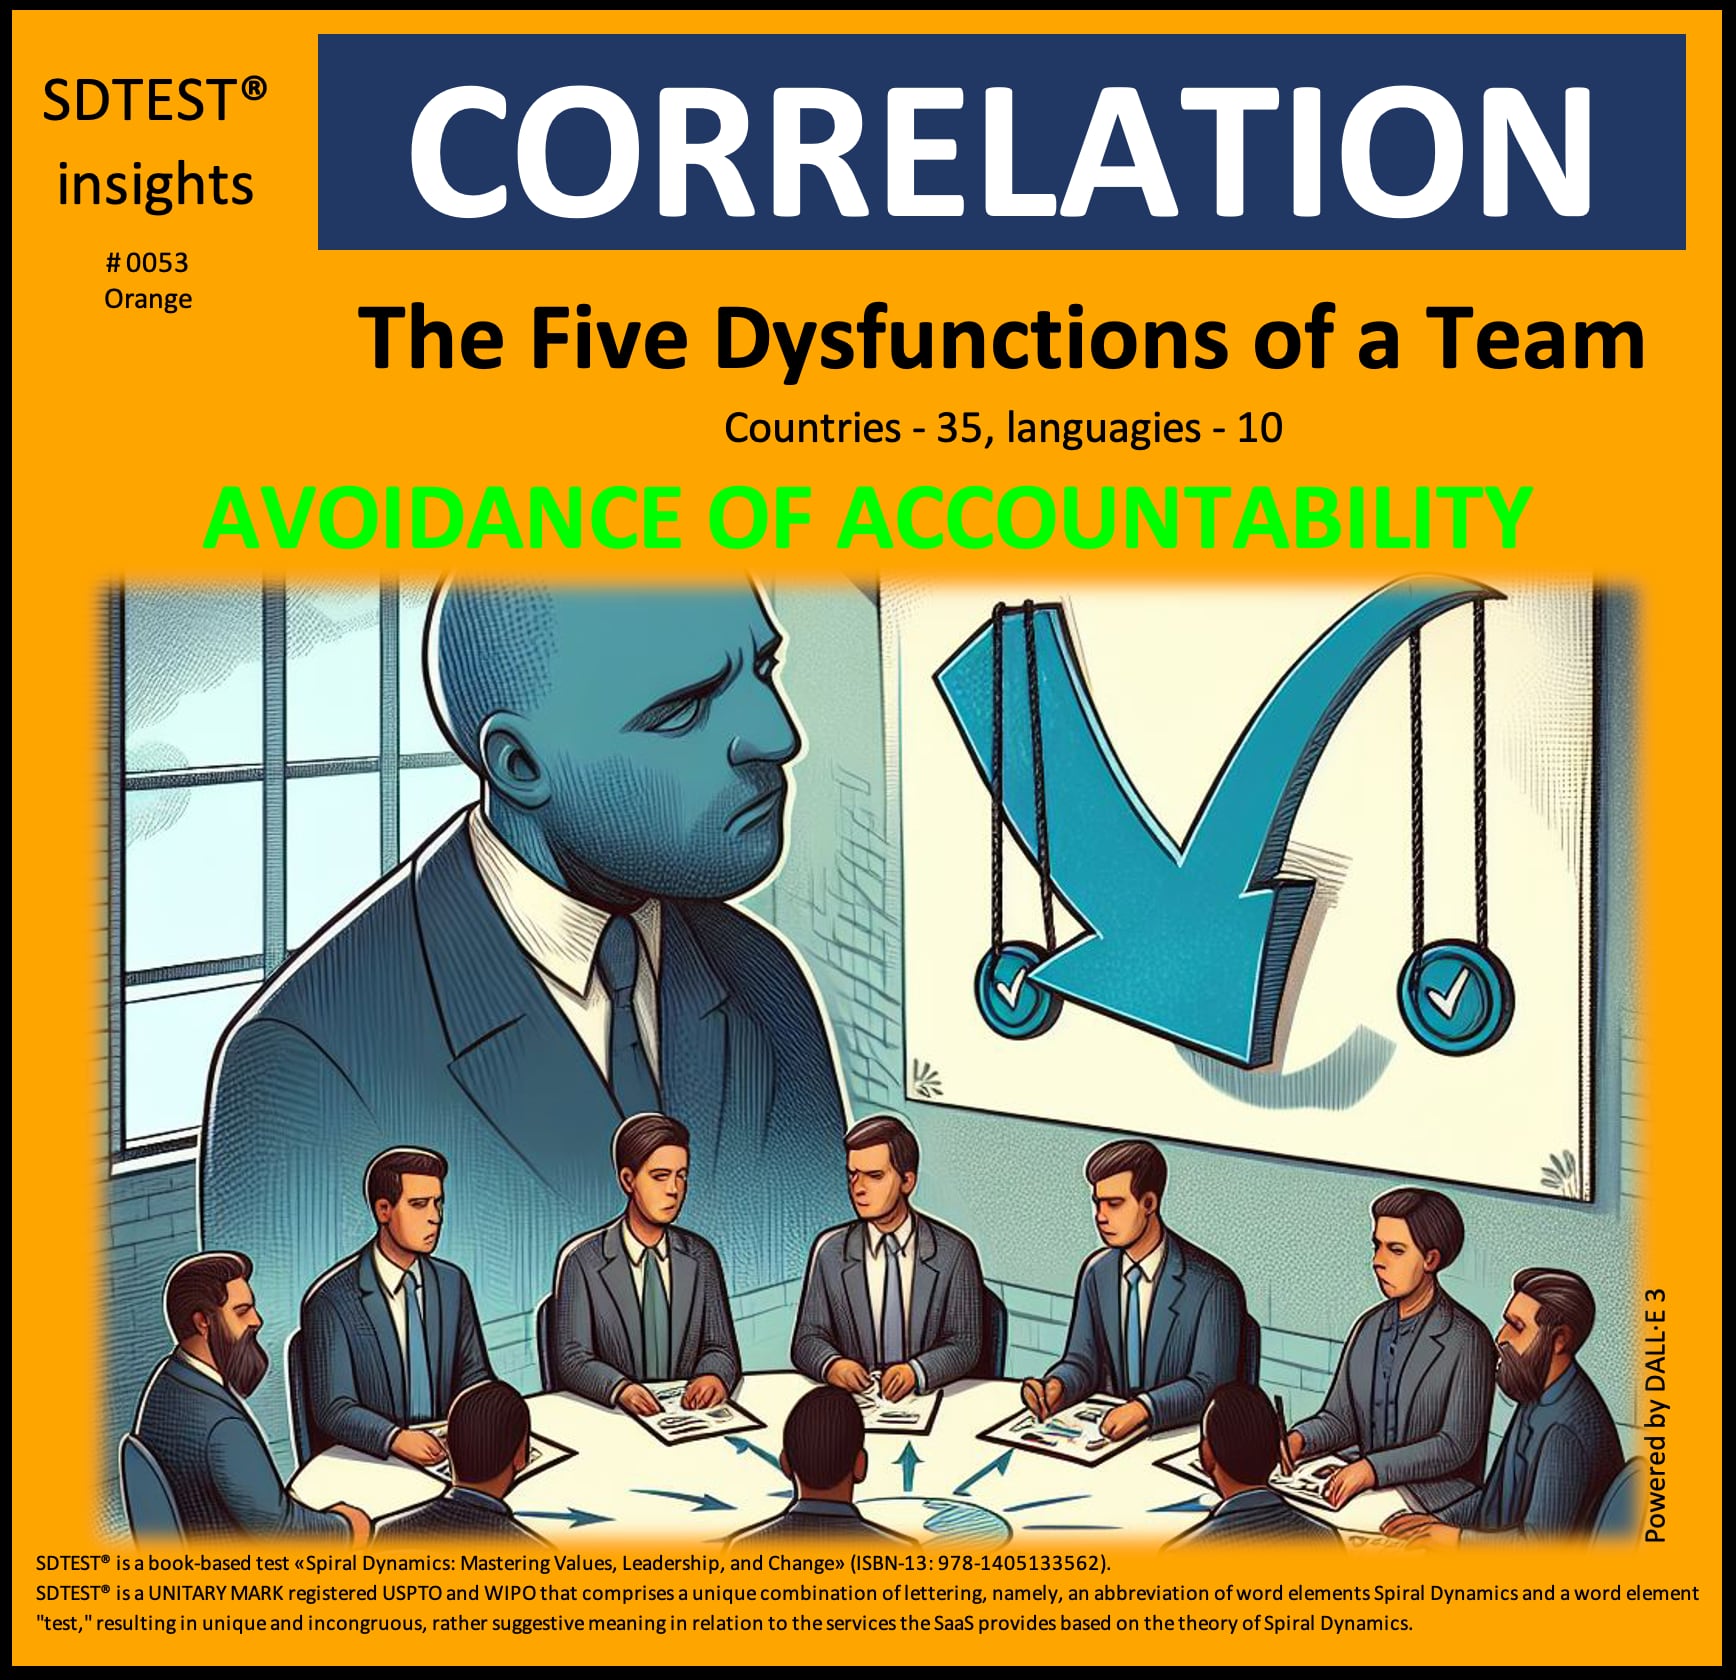
This positive correlation of 0.1706 makes sense, given Orange’s individualistic focus on personal accountability, skill-building, and merit-based advancement. In goal-driven Orange logic, every member should independently develop excellence to achieve team success.
Avoiding accountability can feel protective in the short term but enables mediocrity. Constructive candor accelerates growth, even when uncomfortable. From Orange’s competitive view, holding peers accountable keeps standards high by incentivizing the best to excel.
Orange also correlates accountability avoidance with declining performance metrics—lower profits, lagging innovation, and inefficiencies from dead weight. For Orange, business outcomes speak louder. Qualitative harmony matters less than quantitative returns.
Finally, in Orange's philosophy, progress depends on being self-critical. Organizations and societies mature by spotlighting flaws, not obscuring them. Orange gains energy from identifying system bugs for optimization. The data guides the debugging.
In sum, Orange affiliation with peer accountability reflects its analytical belief in transparency, evidence, and self-correction as central to fulfilling one’s potential. Results rule. Broken should be unpacked, not masked.
0.0723 between the Sent employees on unpaid vacations and the Green stage.
The critical value of the correlation coefficient for a normal distribution, by William Sealy Gosset (Student) r = 0.0587. This positive correlation of 0.0723 meets the reliability criteria but does not necessarily imply causation.
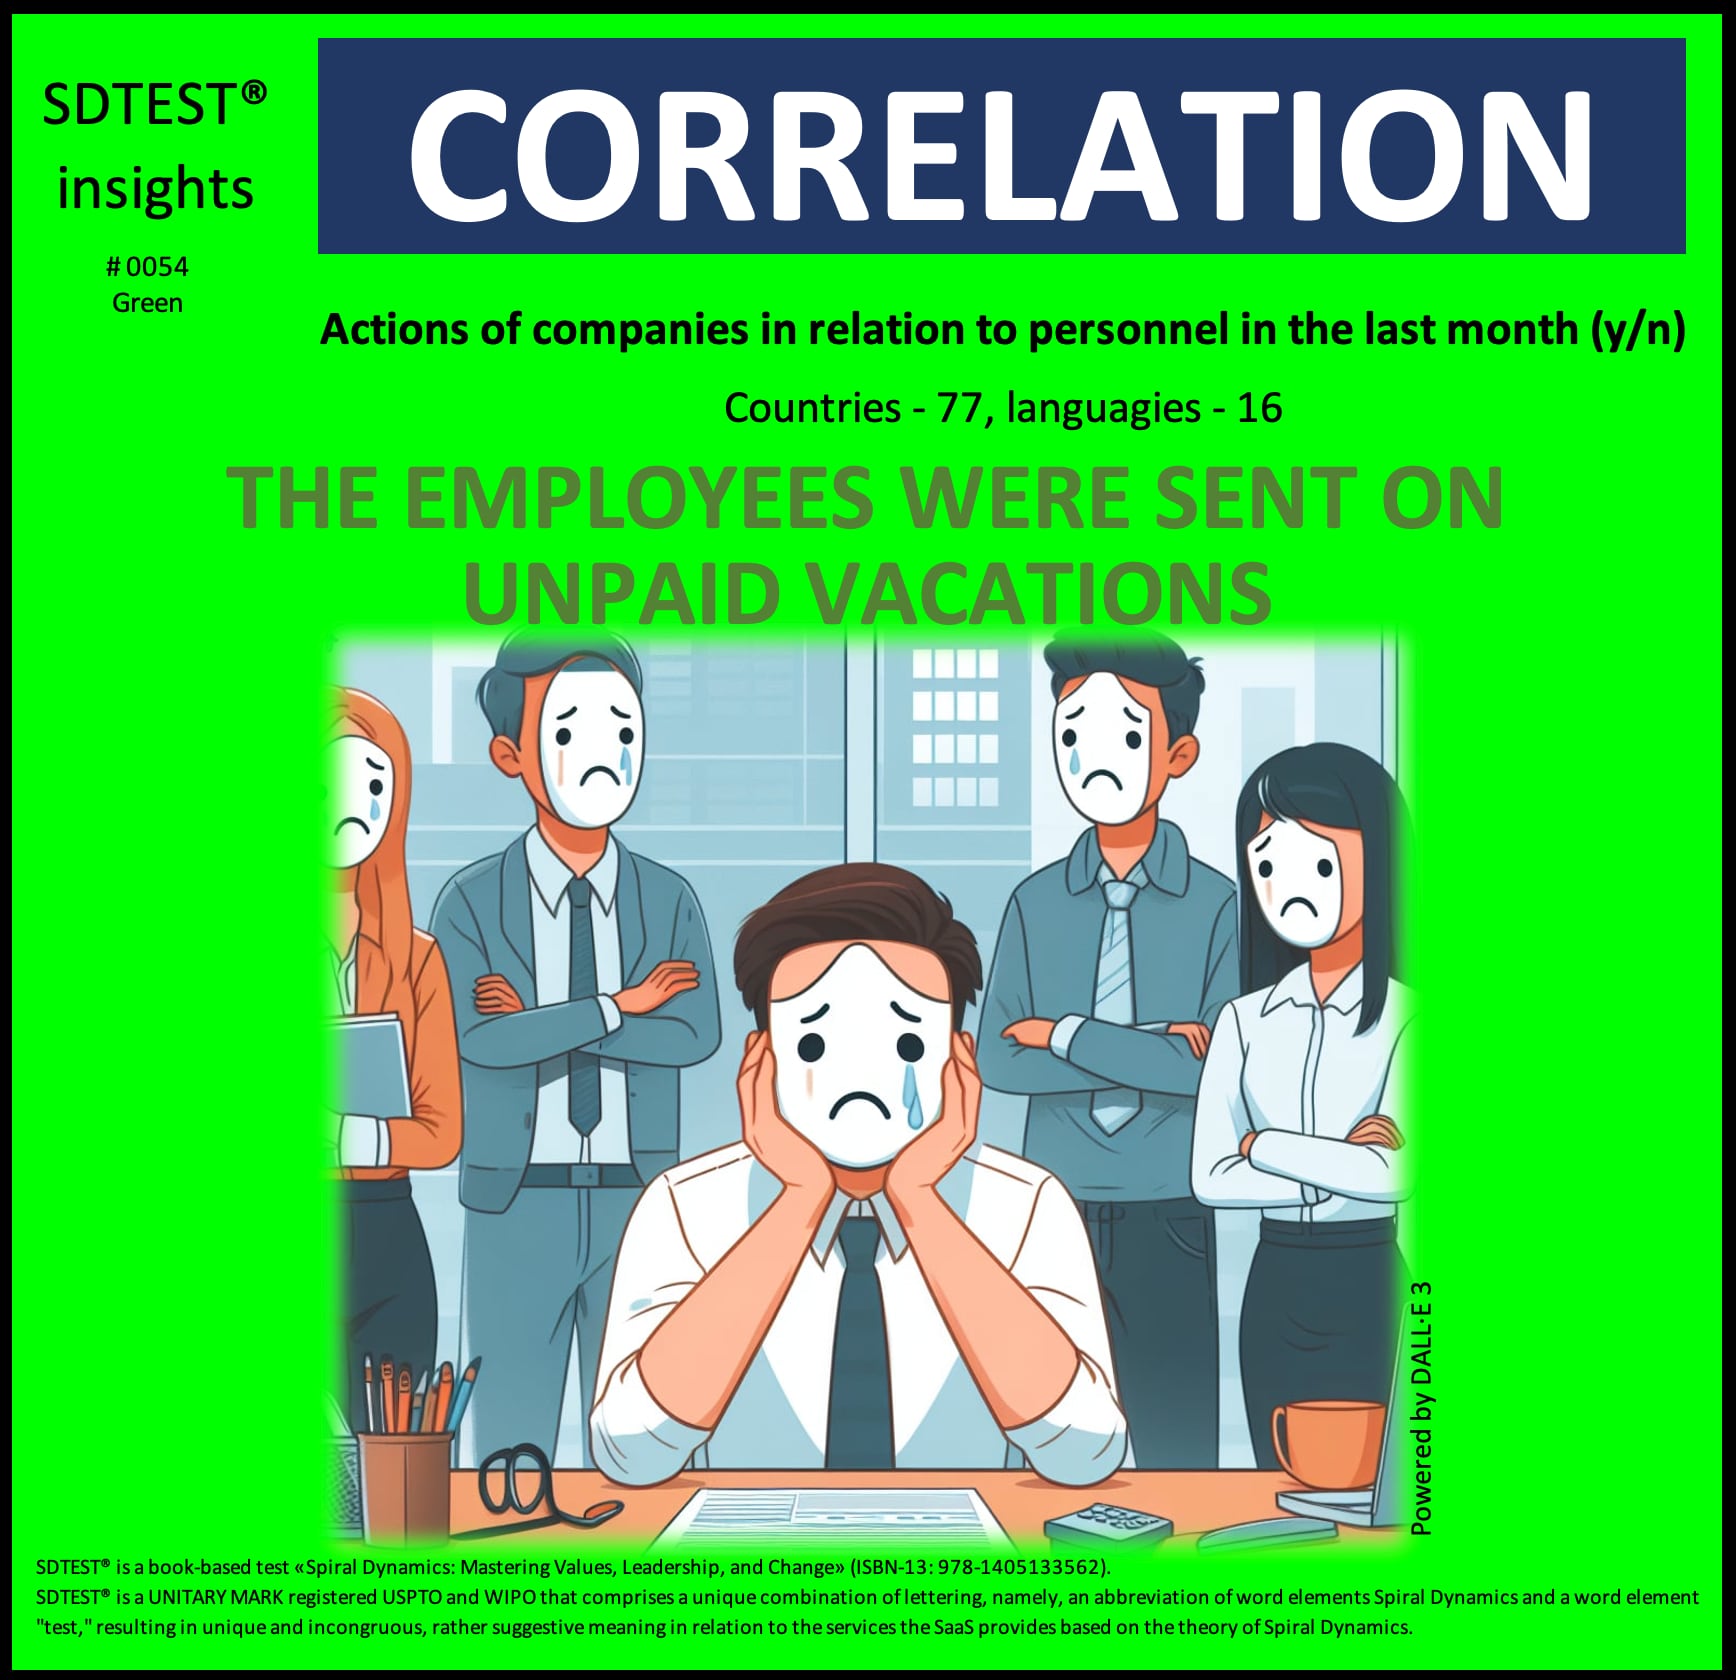
This positive correlation of 0.0723 is notable given Green's focus on equality, relationships, and worker empowerment. Though subtle, it hints at nuances in Green's orientation during times of organizational crisis.
While unpaid leave can strain income reliance for vulnerable staff, Green also recognizes mandatory layoffs destabilize even more. Some income beats no income. Maintaining affiliation might enable smoother workforce transitions than severing whole livelihoods.
Additionally, unpaid leave suggests a potential return once conditions improve - a hiatus over termination. The correlation signals Green's attempts at creative flexibility for weathering turmoil without fully dismantling community bonds during restructuring.
Of course, the lower income itself significantly stresses well-being. But seen through a systemic lens, workforce continuity holds space for recovery. Some near-term uneven sacrifices might achieve longer-term stability.
Green reveals its paradox - hungry for ideal justice yet pragmatic. Unpaid leave risks exploitation. But in volatile contexts with constrained options, Green may correlate leave with hope and bridge-building back toward restored equilibrium.
-0.0809 between the Staff reductions and the Yellow stage.
The critical value of the correlation coefficient for a normal distribution, by William Sealy Gosset (Student) r = 0.0763. This negative correlation of -0.0809 meets the reliability criteria but does not necessarily imply causation.
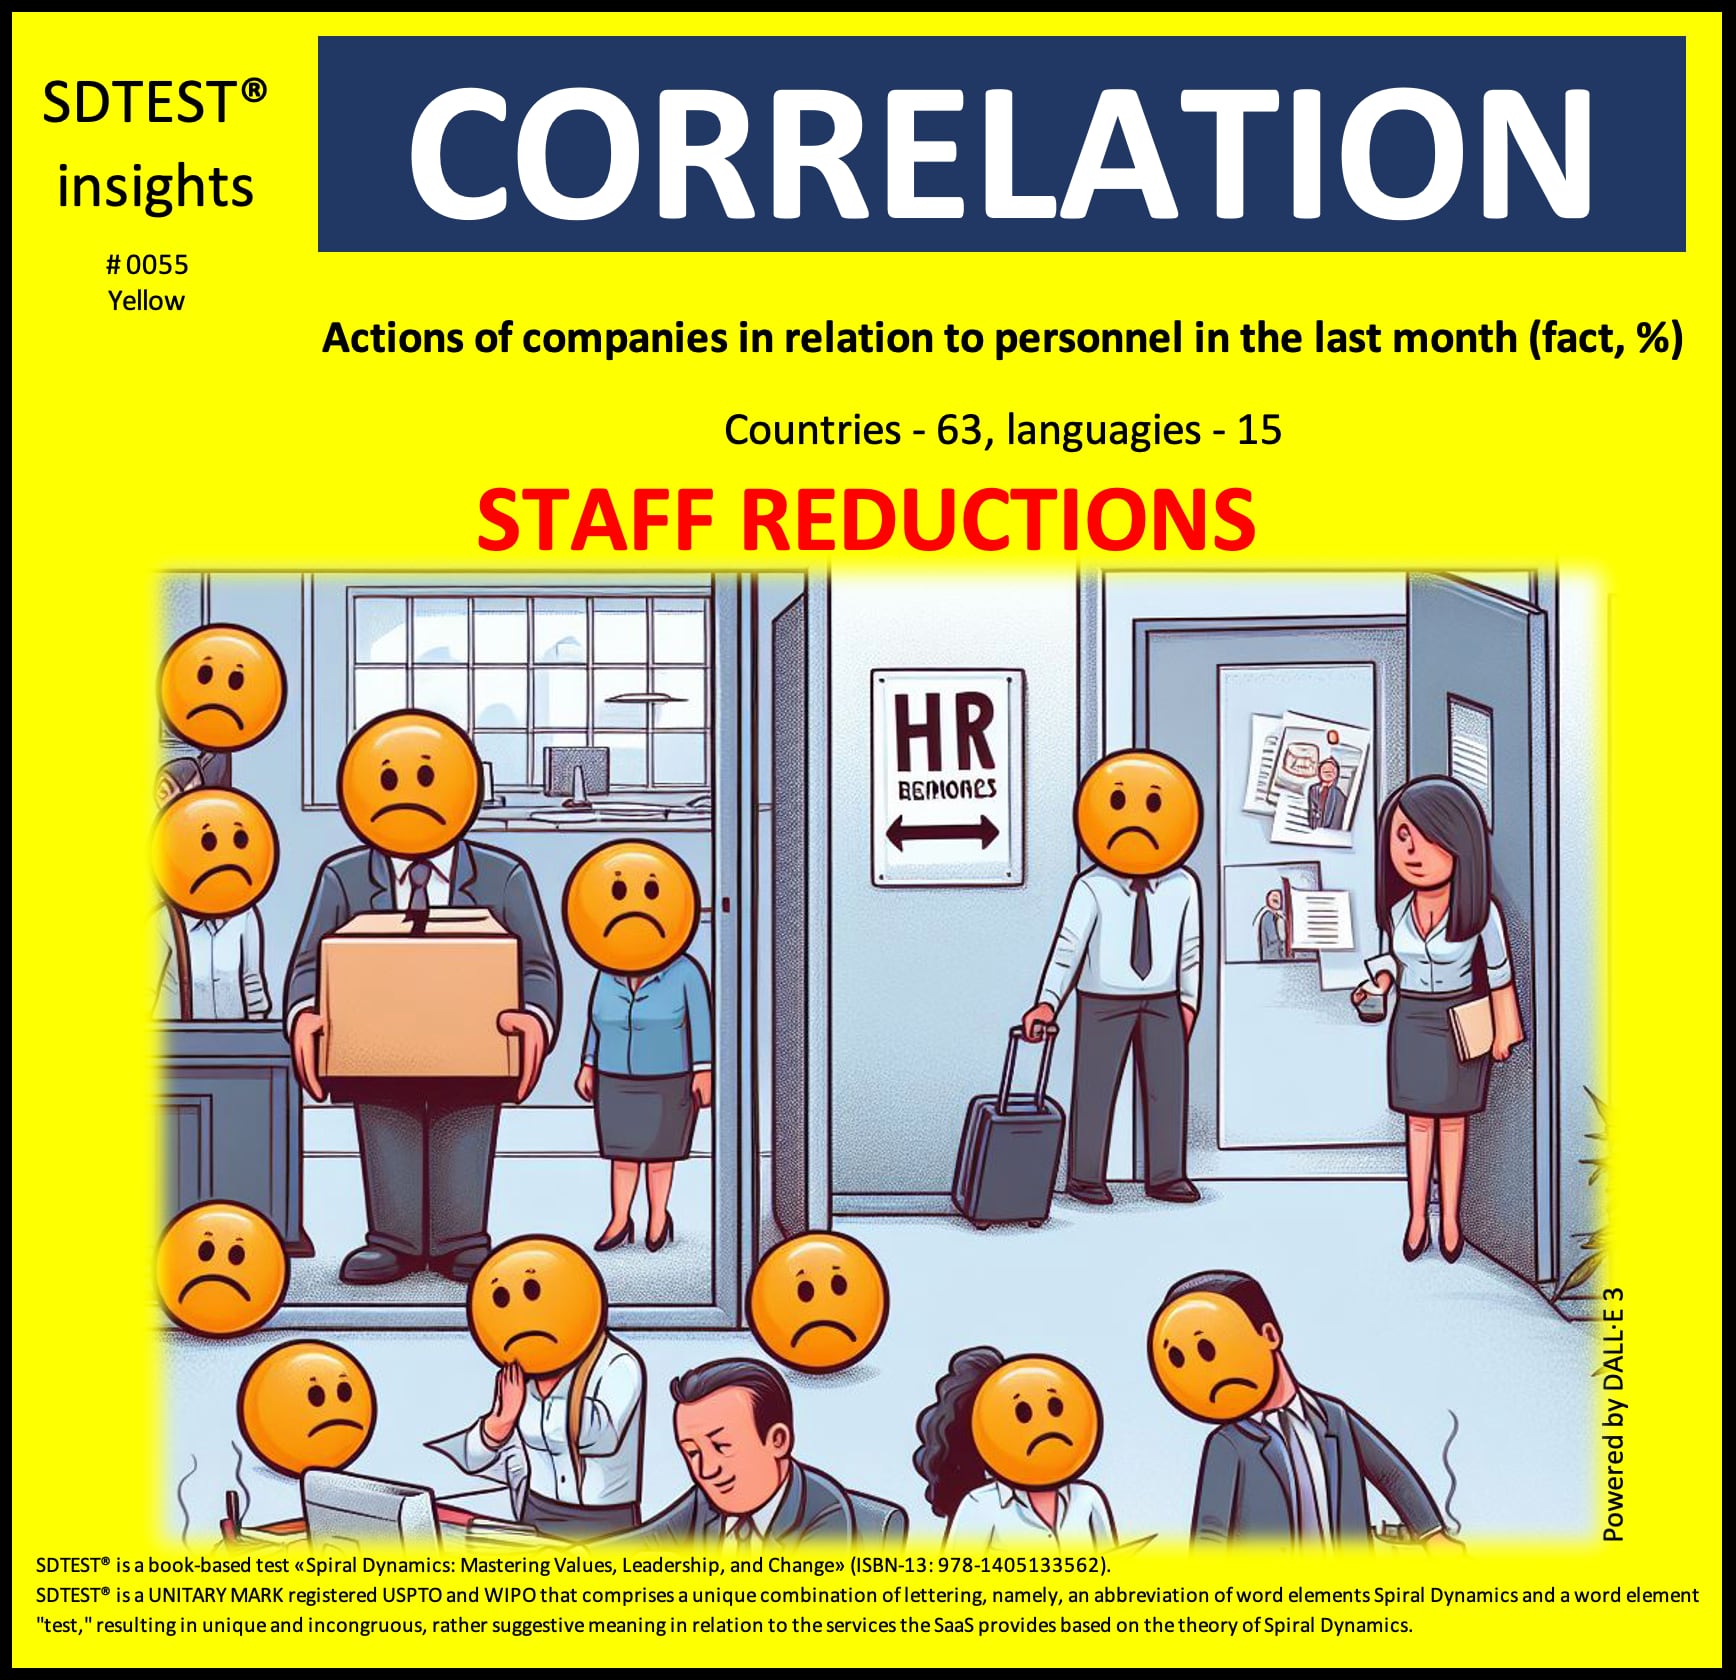
This negative correlation of -0.0809 suggests that those identifying with the Yellow worldview are *more likely* to reject staff reductions as an appropriate company action toward personnel.
In other words, the more someone resonates with Yellow's integrative values, the less they agree with corporations laying off employees - even amidst turbulence. They see all people as interconnected.
While pragmatic in crises, sacrificing jobs still conflicts with Yellow's core aim of evolving systems to uplift collective wellbeing. Pain for some undermines the whole.
So, this correlation indicates Yellow affiliates with lower support for immediate staff reductions. It reflects Yellow's paradoxical thinking - both/and, not either/or - in seeking temporary and systemic solutions that dissolve root causes of instability without harming vulnerable communities.
In our analysis of the poll "Biggest problems facing my country," we found an intriguing negative correlation that warrants closer examination:
-0.0887 between the Inflation and the Turquoise stage.
The critical value of the correlation coefficient for a normal distribution, by William Sealy Gosset (Student) r = 0.0531. This negative correlation of -0.0887 meets the reliability criteria but does not necessarily imply causation.
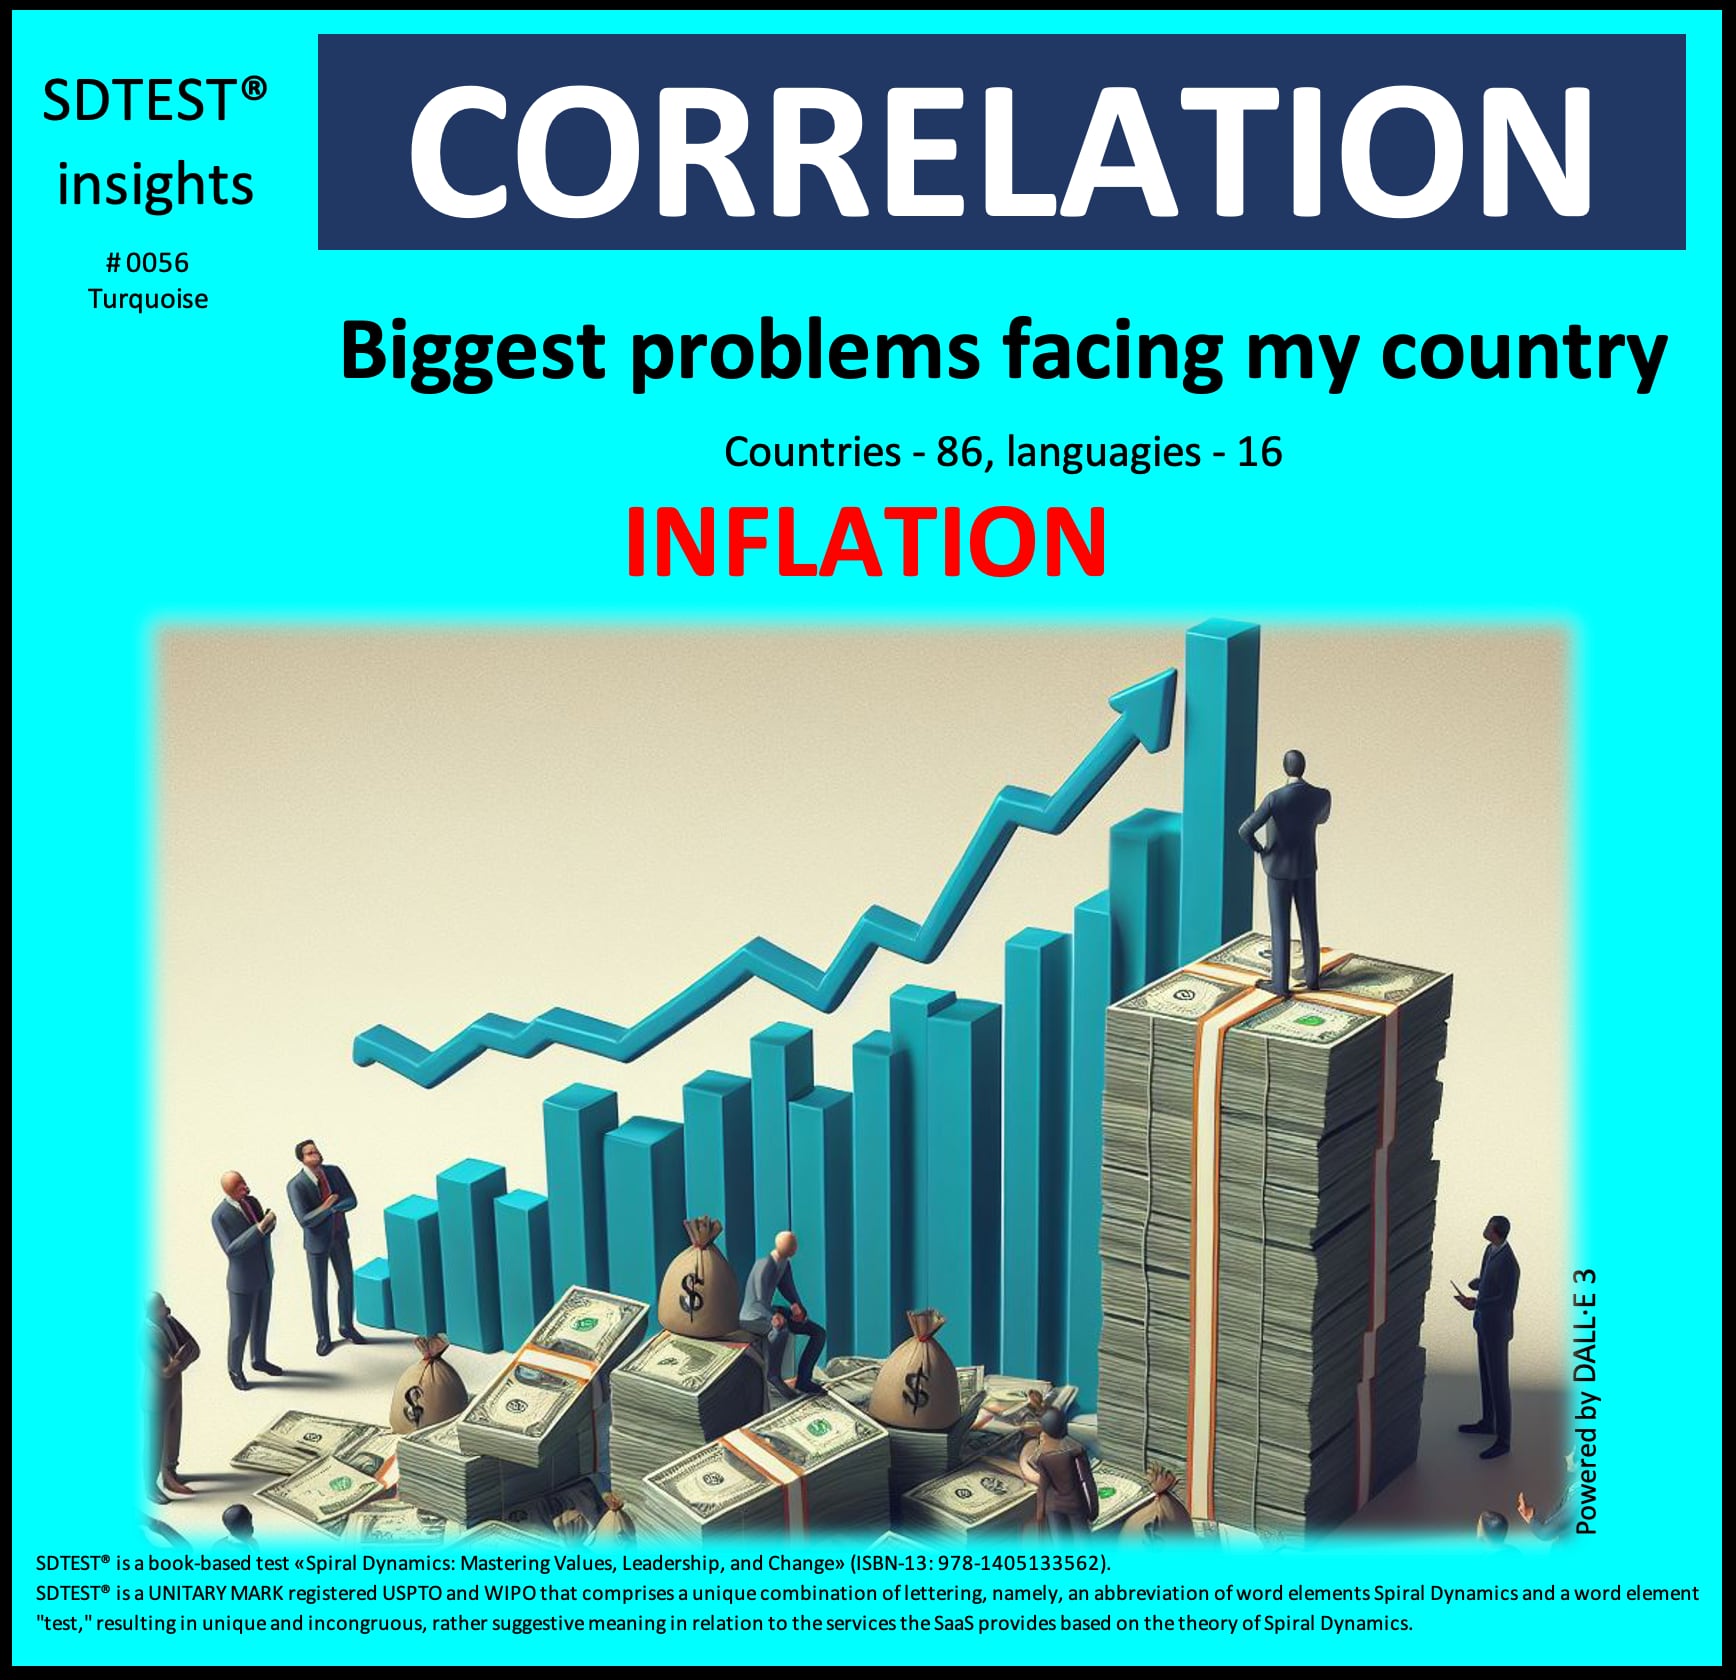
This negative correlation of -0.0887 indicates Turquoise identifies less with rising consumer prices as a core societal challenge. Its worldview sees interconnectivity in living systems beyond monetary measurements.
Turquoise recognizes inflation as a symptom of imbalances needing systemic change, not an isolated problem. The focus turns to transition economic paradigms for more equitable resource distribution benefiting people and the planet.
Additionally, Turquoise correlates with decreased inflation concern due to its shift from self-maximization towards intentional sustainability. Living simply with less fosters resilience. Tightening belts care for communities coping with hardship.
However, Turquoise still empathizes with consumer anxiety amid volatile markets. Its compassion compels advocacy for policies protecting those struggling most across interconnected systems. Turquoise addresses immediate needs while transforming root causes.
In sum, this negative correlation reflects Turquoise’s deemphasis on inflation as a prime issue apart from broader social justice and ecological challenges. It compels visionary leadership to rebalance whole economic designs through wise intervention and activism.


