prueba basada en el libro «Spiral
Dynamics: Mastering Values, Leadership,
and Change» (ISBN-13: 978-1405133562)
Patrocinadores

AI Assistants Boost Beginners More Than Experts, Study Shows Correlation

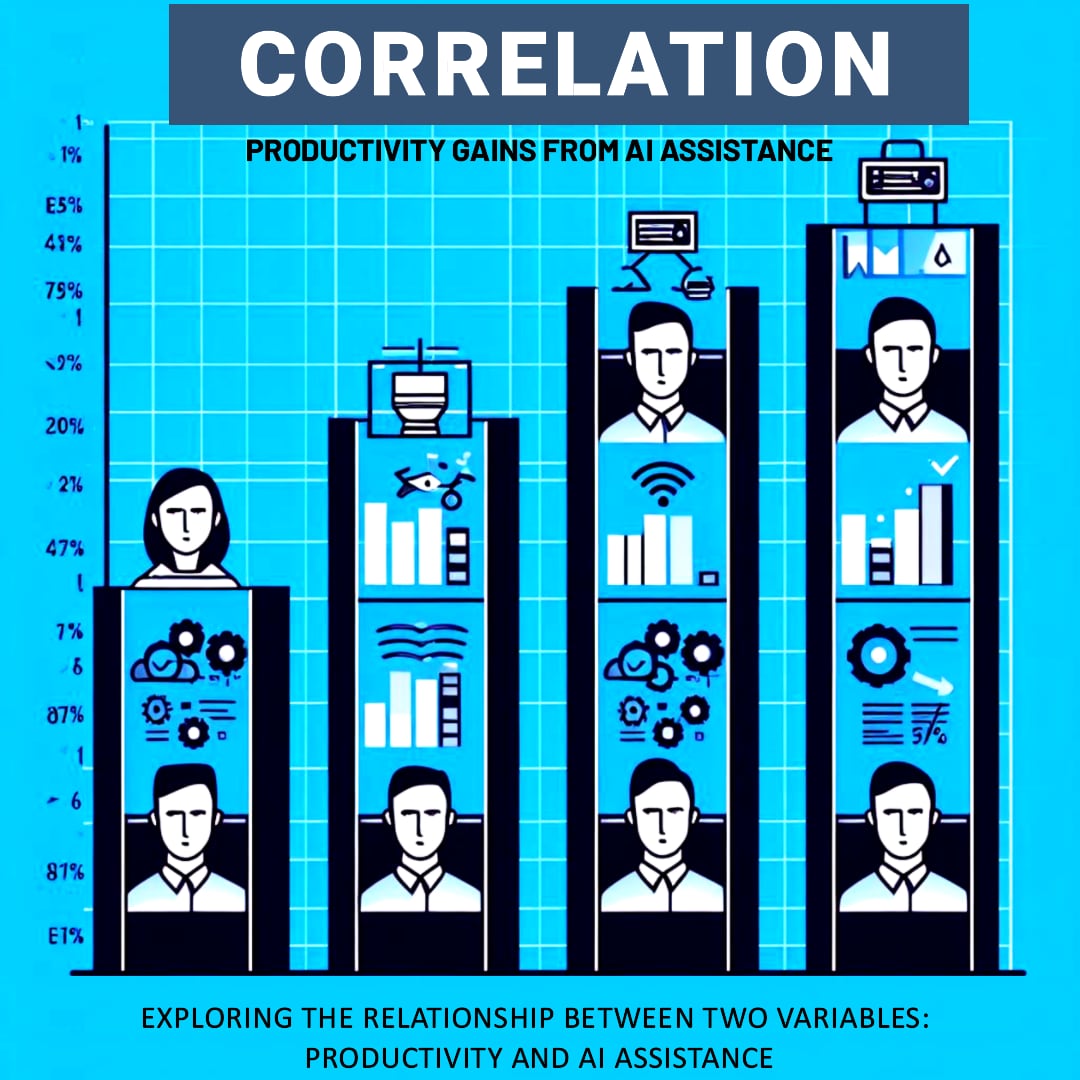
There once was an AI named Chat who was really good at repeating back information it already knew. One day, Chat was given to some office workers [1] to help them with their jobs. Some of the workers were experts at their jobs, while others were still learning.  


At first, Chat helped all the workers get more work done faster - even the experts! But soon, the experts noticed something funny. The workers who were still learning got way MORE help from Chat. The new workers improved a lot using Chat, doing their work faster and better than ever before!   


The experts wondered why Chat didn't help them as much. That's when they realized - that Chat is an expert at repeating back facts but can't come up with brand new ideas. So, for workers who already knew those facts, Chat didn't offer them that much new help. But for newer workers still learning those basics, Chat was able to teach them so much more!


This shows a correlation - as in, two things that relate to each other and change together. The more expert a worker already was, the less helpful Chat was for them. But for newer workers, Chat could help them almost as much as the experts! It's because of their different starting points. Chat has a limit to how expert it can be. So, the closer a worker already was to Chat's expertise, the less new stuff Chat offered them.


The experts and newbies improved at different rates thanks to Chat. Their own expertise compared to Chat's matters for how much more they can learn. That connection in how much they improve is the correlation!


The SDTEST® gives clues to someone's motivational values. However, additional polls can provide more pieces of the puzzle.


Imagine also giving an "A.I. and the end of civilization" poll. It asks people to rate at the agree or disagree level. 


Now imagine 100 people who took both tests. You could match up each person's SDTEST® colors with their rated answers about the danger of AI.


Comparing tests gives an expanded picture of values in action. More puzzle pieces make the whole image more apparent!


Multiple tests can work together, like colors blending on a palette. Other polls reveal what engages your values, like what is the perception of the danger of AI. Combined, they paint a richer picture of what motivates our thoughts and deeds.


Below you can read an abridged version of the results of our VUCA poll “A.I. and the end of civilization“. The full results of the poll are available for free in the FAQ section after login or registration.


Inteligencia artificial y el fin de la civilización

País
Lenguaje
-
Mail
Recalcular
Existe una correlación estadísticamente significativa (%)
Distribución normal, por William Sealy Gosset (estudiante) r = 7.63
Distribución no normal, por Spearman r = 0.31
Preguntas de la encuesta
Todas las preguntas
Todas las preguntas
1) Seguridad (¿Cuánto está de acuerdo o en desacuerdo?)
2) Control (¿Cuánto está de acuerdo o en desacuerdo?)
Distribución
#
Correlacion positiva,%
#
Correlación negativa,%
Normal
0.8
Answer 1
1.7
Answer 2
5
Answer 3
1.5
Answer 4
2.4
Answer 5
#1
-6.2
Answer 10
-5.6
Answer 11
#1
1.8
Answer 6
4.3
Answer 7
2.6
Answer 8
8.2
Answer 9
#2
-5.5
Answer 12
-4.7
Answer 13
-4.1
Answer 14
#2
Normal
0.2
Answer 10
3
Answer 11
5.2
Answer 4
#1
-5.5
Answer 1
-0.8
Answer 2
-1.3
Answer 3
-0.8
Answer 5
#1
5
Answer 6
0.3
Answer 14
8
Answer 8
0.4
Answer 9
#2
-7.5
Answer 12
-1.6
Answer 13
-1.7
Answer 7
#2
Normal
4.5
Answer 10
0.1
Answer 5
#1
-0.8
Answer 1
-1.1
Answer 2
-3.2
Answer 3
-0.3
Answer 11
-0.1
Answer 4
#1
8.6
Answer 13
1.4
Answer 8
#2
-1.8
Answer 12
-1.4
Answer 6
-1.3
Answer 7
-7.4
Answer 14
-2.2
Answer 9
#2
Normal
4.9
Answer 2
4.8
Answer 11
8
Answer 4
#1
-9.7
Answer 1
-3.1
Answer 10
-4.2
Answer 3
-1
Answer 5
#1
5.8
Answer 12
3.1
Answer 13
3.5
Answer 14
0.3
Answer 8
#2
-0.1
Answer 6
-6.3
Answer 7
-8.5
Answer 9
#2
Normal
10.9
Answer 1
4
Answer 10
1.8
Answer 3
#1
-0.6
Answer 2
-1.9
Answer 11
-8.2
Answer 4
-5.4
Answer 5
#1
5.8
Answer 12
1.6
Answer 7
6.3
Answer 14
#2
-3.9
Answer 13
-4.2
Answer 6
-1
Answer 8
-3
Answer 9
#2
No
normal
0.8
Answer 3
11.4
Answer 5
#1
-0.1
Answer 1
-0.2
Answer 10
-5.2
Answer 2
-1
Answer 11
-5.6
Answer 4
#1
1.7
Answer 12
1.2
Answer 7
3.5
Answer 14
6.4
Answer 9
#2
-2.9
Answer 13
-3.3
Answer 6
-4.5
Answer 8
#2
Normal
7.8
Answer 1
2.9
Answer 10
2.1
Answer 3
#1
-1.4
Answer 2
-0.4
Answer 11
-4.1
Answer 4
-6
Answer 5
#1
2.8
Answer 12
1
Answer 13
1.9
Answer 6
3.6
Answer 7
0.4
Answer 9
#2
-2.1
Answer 14
-11.1
Answer 8
#2


Exportar a MS Excel
Esta funcionalidad estará disponible en sus propias encuestas de VUCA
OK


[1] https://www.ft.com/content/b2928076-5c52-43e9-8872-08fda2aa2fcf


2023.11.27
Valerii Kosenko
Propietario del producto Saas Pet Project Sdtest®

Valerii fue calificado como psicólogo de pedagogo social en 1993 y desde entonces ha aplicado su conocimiento en la gestión de proyectos.
Valerii obtuvo una maestría y la calificación del gerente del proyecto y del programa en 2013. Durante su programa de maestría, se familiarizó con Project Roadmap (GPM Deutsche Gesellschaft Für Projektmanagement e. V.) y dinámica espiral.
Valerii realizó varias pruebas de dinámica en espiral y utilizó su conocimiento y experiencia para adaptar la versión actual de SDTest.
Valerii es el autor de explorar la incertidumbre del V.U.C.A. Concepto utilizando la dinámica espiral y las estadísticas matemáticas en psicología, más de 20 encuestas internacionales.
Esta publicación tiene 0 Comentario
Responder a
Cancelar una respuesta
Deje su comentario
×
ENCUENTRAS UN ERROR
PROPONE SU VERSIÓN CORRECTA
Ingrese su correo electrónico como lo desee
Enviar
Cancelar
Redirect to your region's domain sdtest.us ?
YES
NO
Bot
sdtest
1
¡Hola! Déjame preguntarte, ¿ya estás familiarizado con Spiral Dynamics?