16 Reasons People Give Up on Their Goals
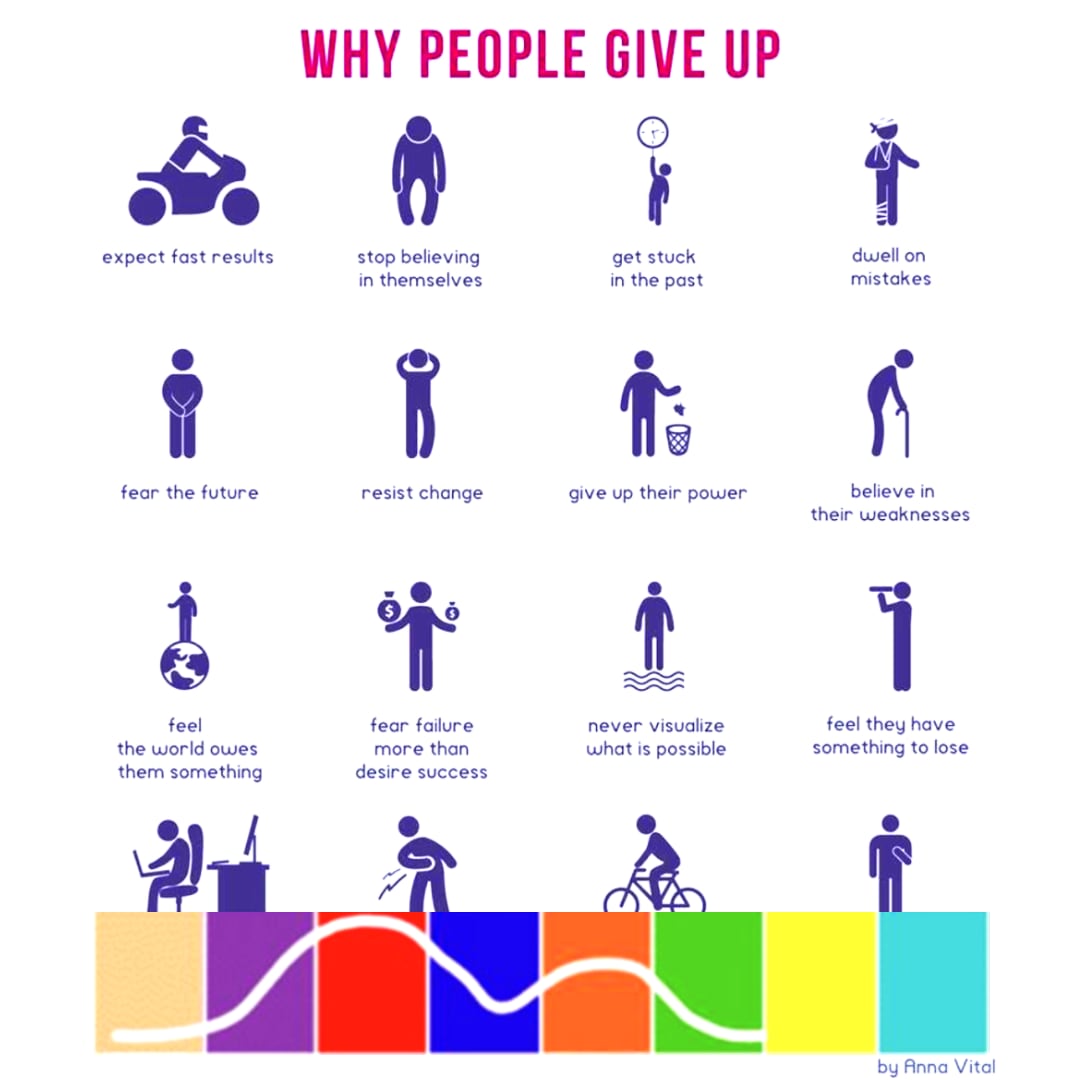
Goal abandonment is a major issue, with sources estimating that over 90% of people fail to achieve New Year's resolutions (Marist Poll, 2022). This article analyzes research correlating reasons people give up on goals with Spiral Dynamics developmental stages. The list of 16 common reasons was compiled by Anna Vital [1,2,3], owner of Adioma [4], and published via infographic on social media [5]. By understanding the connections between goal abandonment factors and psychological value systems, tailored interventions can be designed to improve motivation and perseverance.
Introduction
Achieving meaningful goals is critical for a sense of purpose, yet many abandon this pursuit when challenges arise. While giving up is rarely due to a lack of desire, complex psychological factors often sabotage perseverance. Reasons for quitting vary based on one's values, beliefs, and worldview. A one-size-fits-all approach is unlikely to help most overcome obstacles.
This article will analyze new research correlating reasons for abandoning goals with Spiral Dynamics, a framework of psychological development. By uncovering connections to Spiral Dynamics value-systems, data-driven insights can enable customized strategies to boost motivation and achievement. This psychographic approach represents a promising avenue for improving perseverance.
This article will analyze the next SDTEST poll, Reasons Why People Give Up, to uncover why people give up on goals using the framework of Spiral Dynamics. Spiral Dynamics proposes that human psychological development progresses through eight key stages called “value-systems” or vMEMEs. Each vMEME involves distinct motivations, perspectives, and behaviors.
Spiral Dynamics categorizes human cognitive, moral, and value systems into eight color-coded stages - from Beige instinctual drives to Turquoise holistic thought. Each stage represents a distinct motivational focus.
The research provides data-driven insights into this issue by correlating common reasons for abandoning goals with Spiral Dynamics vMEMEs. Understanding these connections can enable tailored strategies to help individuals override demotivation based on their unique mindsets and values. This psychographic approach represents a promising avenue for improving perseverance and achievement.
The analysis in this article is based on recent data from an international poll,
Reasons Why People Give Up, conducted by SDTEST across 62 countries. The poll compiled responses from a minimum of 704 participants, spanning 15 languages, between August 2022 and the present day.
Participants were presented with a list of 16 common reasons people give up on their goals. Anna Vital originally developed this list of reasons in her infographic on the topic. The SDTEST poll,
Reasons Why People Give Up, asked respondents to select all the reasons for abandoning goals in their lives and rate their choices on a 10-point scale, where 10 is the maximum value.
The results provided insights into the most prevalent factors behind goal abandonment among the poll respondents. The top five most commonly selected reasons were:
- Feel sorry for themselves (7%)
- Stop believing in themselves (8%)
- Expect fast results (8%)
- Fear failure more than desire success (7%)
- Dwell on mistakes (7%)
This SDTEST poll, Reasons Why People Give Up, provides real-world data on goal abandonment factors that will be analyzed through the lens of Spiral Dynamics theory. Identifying connections between the reasons people commonly give up and psychological value systems can enable targeted solutions.
Revealing connections between the reasons people give up on goals and their psychological worldviews can provide insights into tailored solutions to improve motivation and achievement for individuals based on an understanding of their values and beliefs. This psychographic approach has the potential to move beyond one-size-fits-all interventions to address the complex human behaviors behind goal abandonment. By leveraging the theory of Spiral Dynamics, this analysis aims to uncover actionable strategies for supporting perseverance.
Overview of Key Findings from Poll
The SDTEST poll, Reasons Why People Give Up, asked respondents to select all the reasons for abandoning goals in their lives and rate their choices on a 10-point scale, where 10 is the maximum value. Below, you can read an abridged version of the results of our VUCA poll. The full results of our VUCA poll are available for free in the FAQ section after login or registration.
The rate of the reasons findings from the poll for 2022-08-01 – the current date you can see in the widget below on the tab Charts. The chart at the top displays the respondents' rate of the listed reasons. The chart at the bottom displays the respondents' responses to the SDTEST by colors of the Spiral Dynamics. This factual data is used to calculate the correlation with the reasons that respondents indicate in their answers.
It is important to note that the correlation values change in the online widget depending on the number of response results. Therefore, the values indicated in the text may not match the actual calculations displayed in the widget. The full results of our VUCA poll are free in the FAQ section after login or registration.
사람들이 포기하는 이유 (Anna Vital)
이 기능은 자신의 VUCA 폴링에서 사용할 수 있습니다.
The top five most commonly selected reasons were:
- Expect fast results (8%)
- Stop believing in themselves (8%)
- Feel sorry for themselves (7%)
- Fear failure more than desire success (7%)
- Dwell on mistakes (7%)
This overview of the key results provides context on the most prevalent factors behind participants abandoning their goals. Next, correlations between these reasons and Spiral Dynamics will be analyzed.
Correlating Reasons with Spiral Dynamics Stages
The poll responses were statistically correlated with the eight Spiral Dynamics “vMEMEs” (value systems) to reveal connections between the goal abandonment reasons and Spiral Dynamics value systems.
Each of the 16 reasons from the poll was calculated with a correlation coefficient (Normal distribution, by William Sealy Gosset (Student) and Non-Normal distribution, by Spearman r) to measure its relationship with each of the eight vMEMEs. The vMEMEs, also known as colors.
The correlation coefficient quantifies the strength of the linear relationship between each reason and vMEME, with values ranging from -1 to 1. Values close to -1 indicate a strong negative correlation, values close to 1 indicate a strong positive correlation, and values near 0 indicate little to no correlation.
Using established statistical methods, correlations above 0.074 were considered statistically significant based on the sample size of 704 poll responses. This critical value allows us to focus the analysis on the most meaningful correlations that are unlikely to be due to chance alone.
The Spiral Dynamics framework will present and discuss the most significant positive and negative correlations in the next section. This data-driven approach helps uncover how different value systems relate to the psychology behind abandoning goals.
Below are the correlation coefficients between each of the 16 reasons why people give up and the eight Spiral Dynamics colors. The critical value of the correlation coefficient Normal distribution, by William Sealy Gosset (Student) r = 0.074.
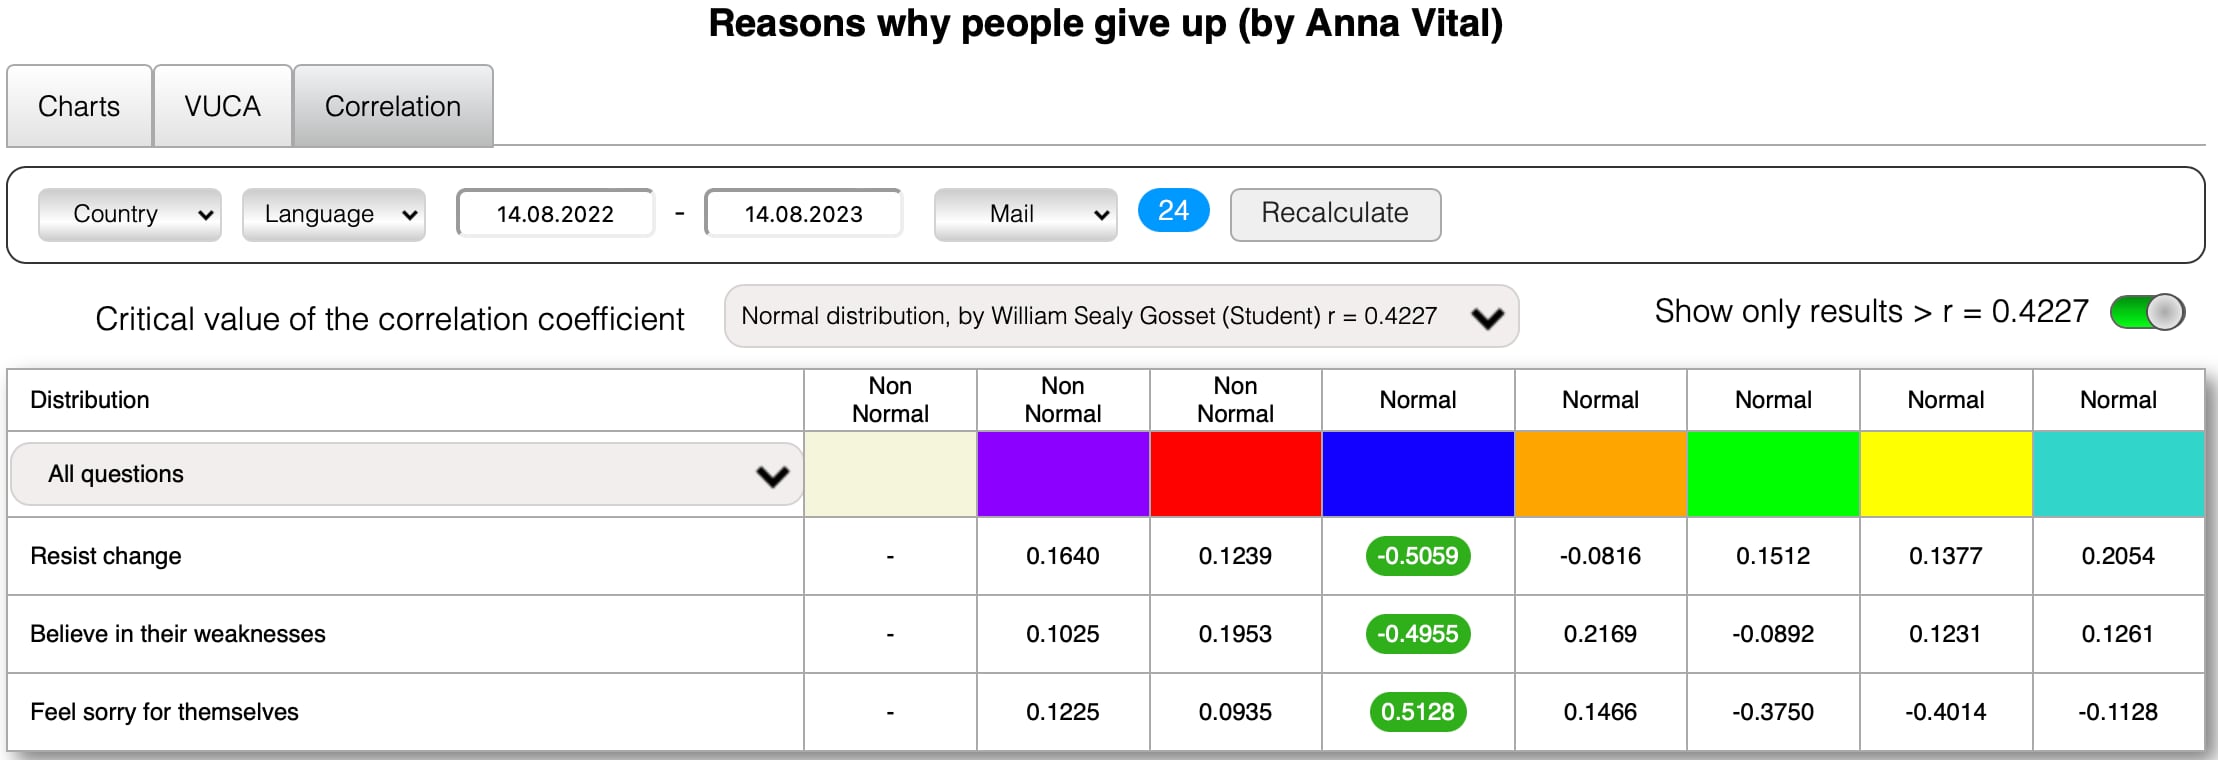
Here are examples of the reasons of some European countries with a correlation coefficient greater than a critical value of the correlation coefficient Normal distribution, by William Sealy Gosset (Student) r.
France
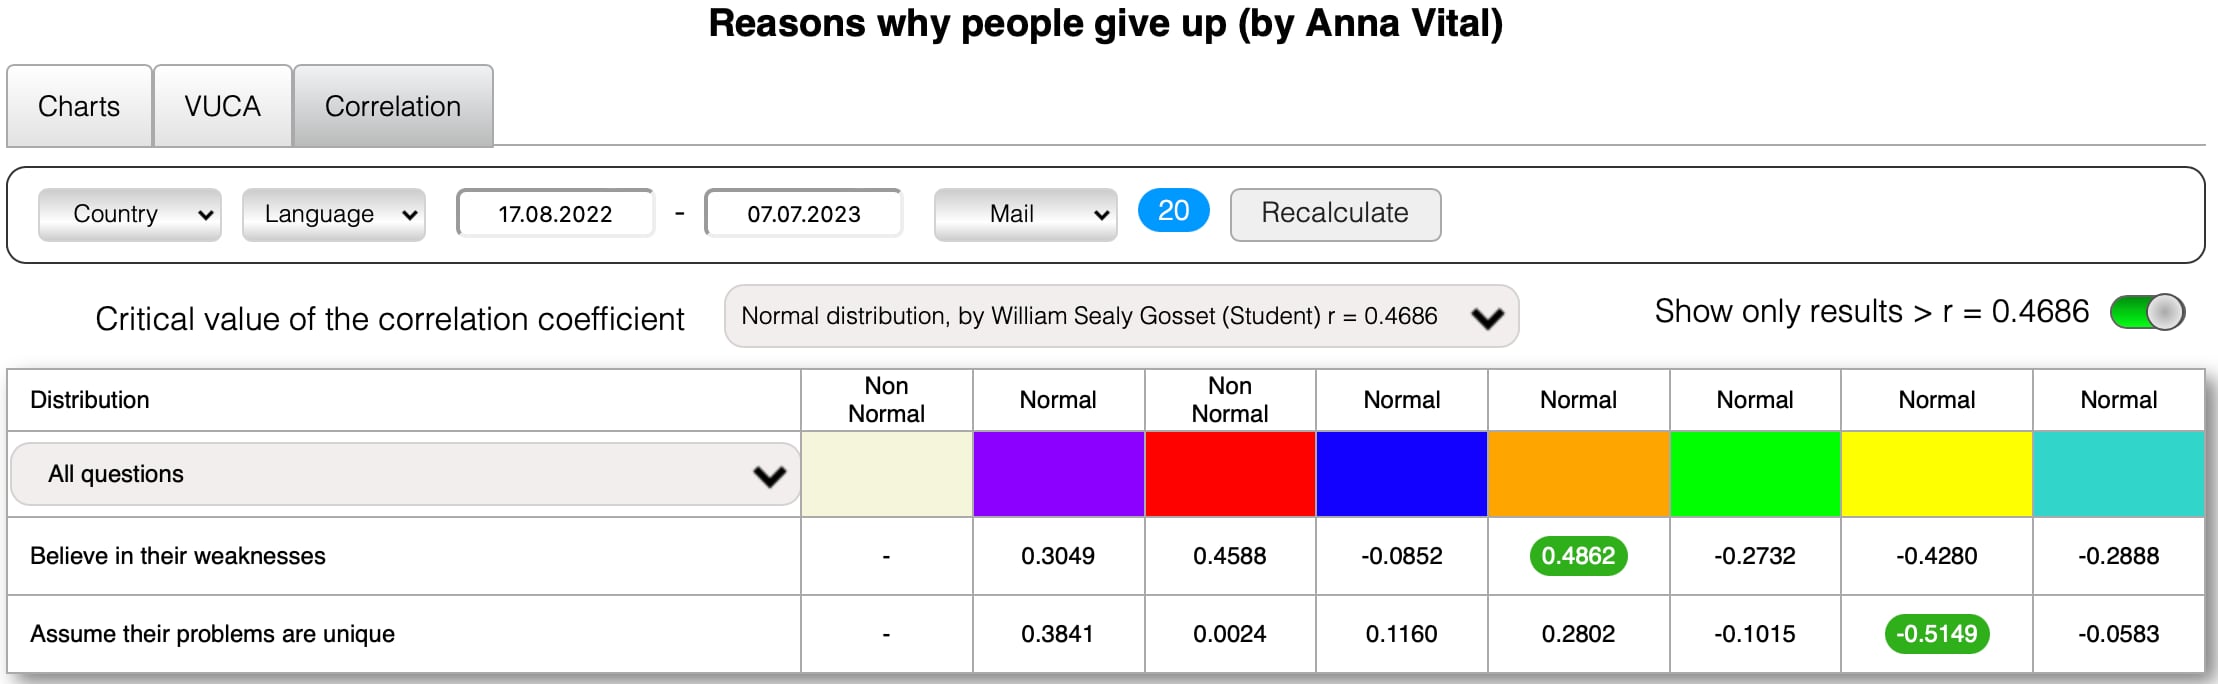
Germany
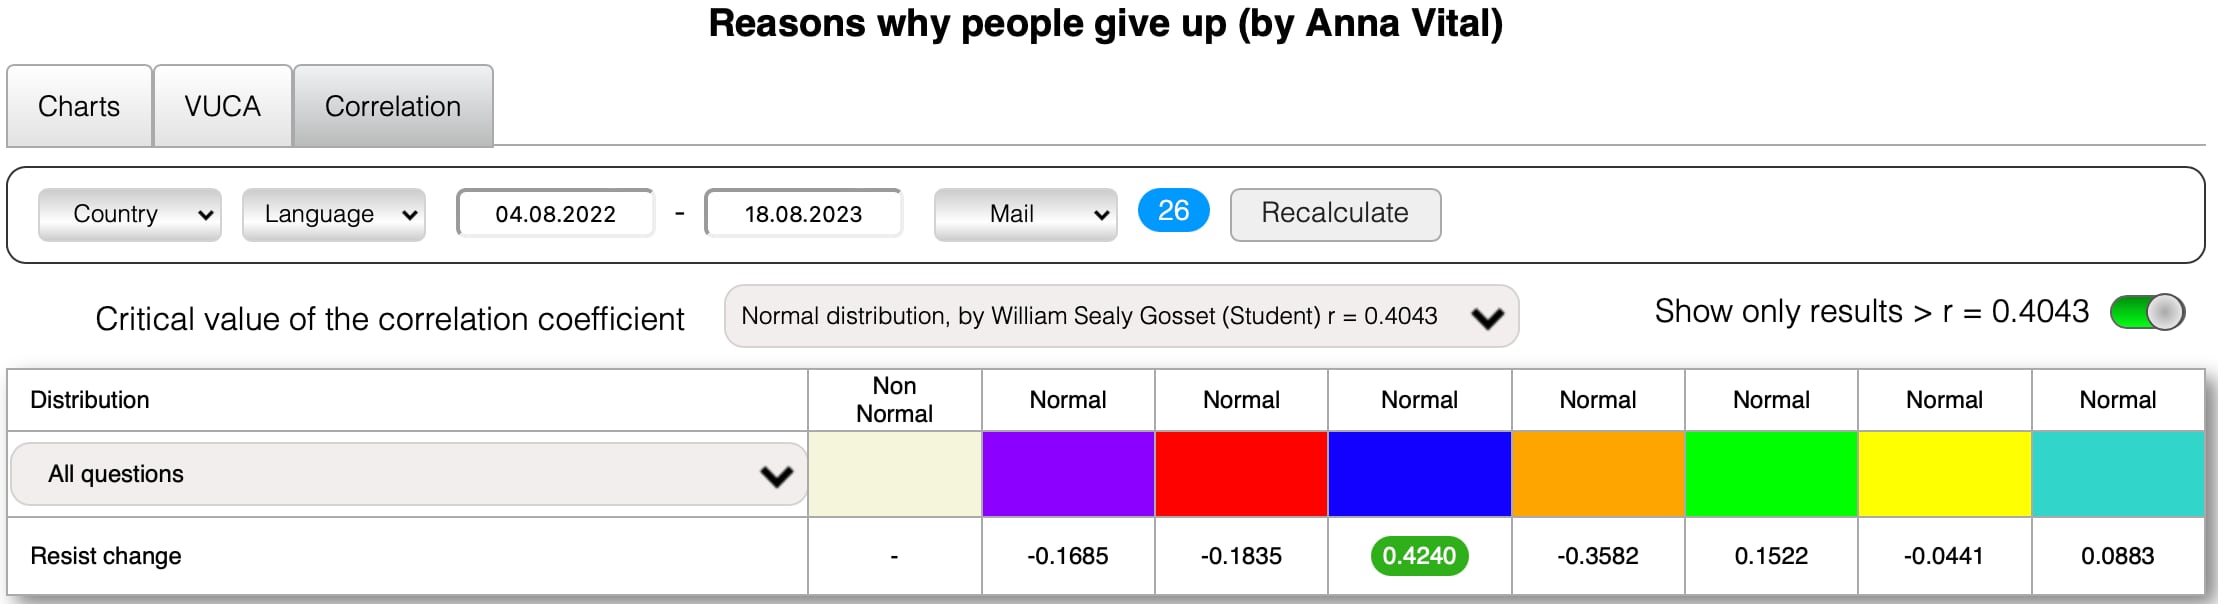
Netherlands
You can not only just create your poll in 관세 «V.U.C.A 설문 조사 디자이너» (with a unique link and your logo) but also you can earn money by selling its results in 관세 «설문 조사 상점», as already the authors of polls.
Interpreting the Correlations
To gain deeper insight into how different groups perceive major issues, the SDTEST results were correlated statistically with the color codes of Spiral Dynamics. This analysis technique matches concerns like inflation or climate change with the psychological and social development levels.
The critical value of the correlation coefficient Normal distribution, by William Sealy Gosset (Student) r = 0.074
Here is an in-depth interpretation of the specified correlation findings:
1. Purple stage has a positive correlation of 0.0858 with "Feel they have something to lose"
- The Purple vMEME prioritizes safety, security, and belonging to their tribe or group. They are focused on avoiding loss. This correlation indicates Purples are more likely to abandon goals that threaten what they have or disrupt their stable tribal relationships.
2. Red stage has a positive correlation of 0.0763 with "Get stuck in the past"
- Reds value power, bold action, and conquest. However, this correlation suggests they can become preoccupied with past glories or traps, hindering their ability to move forward. Their nostalgia for the past may hold them back.
3. Red stage has a positive correlation of 0.0767 with "Fear the future"
- Although Reds seek power, the unknown represents a threat. They rely on familiar hierarchies and ways of doing things. This finding indicates Reds are more prone to abandoning goals that seem uncertain or require venturing into unfamiliar territory.
4. Red stage has a positive correlation of 0.1502 with "Feel the world owes them something"
- Reds feel they must fight for what they deserve in life. This strong correlation shows an enhanced sense of entitlement - Reds are more likely to give up when the world does not provide them what they believe they are owed.
5. Red stage has a positive correlation of 0.0749 with "Fear failure more than desire success"
- While Reds seek power and control, failure challenges their dominant self-image. This finding reflects how fear of failure overrides achievement goals for Reds.
6. Red stage has a positive correlation of 0.077 with "Assume their problems are unique"
- The Red tendency towards egocentrism may isolate them from others. Reds are more likely to see their problems as unlike anyone else's, contributing to abandonment of goals.
7. Red stage has a positive correlation of 0.1124 with "Feel sorry for themselves"
- Reds are prone to drama and victim mentality. Reds are more likely to indulge in self-pity rather than problem-solve when challenges arise, derailing their goals.
8. Blue stage has a negative correlation of -0.0871 with "See failure as the signal to turn back"
- Blues value sacrifice and redemption. So failure spurs them to try harder to get back on the "right path." This inverse correlation shows Blues are less likely to take failure as a sign to give up.
9. Orange stage has a negative correlation of -0.0781 with "Fear the future"
- Oranges are opportunistic and entrepreneurial. They see the future as full of possibilities to leverage for success. This inverse correlation indicates Oranges are less prone to give up due to future uncertainty.
10. Orange stage has a negative correlation of -0.0753 with "Feel they have something to lose"
- Oranges are competitive and achievement-focused. They are less encumbered by fear of loss. This suggests they will push forward with goals despite potential risks.
11. Green stage has a negative correlation of -0.082 with "Give up their power"
- Greens value personal empowerment and self-actualization. They are more likely to persist with goals that align with their identity and passions.
12. Yellow stage has a positive correlation of 0.0906 with "See failure as the signal to turn back"
- Yellows integrate multiple perspectives, including learning from failure. This correlation suggests Yellows are more likely to adopt goals based on lessons from failure, rather than giving up entirely.
13. Turquoise stage has a negative correlation of -0.0768 with "Feel sorry for themselves"
- Turquoises take a systemic, holistic view focused on collective progress. Their goal persistence is less affected by self-pity.
Drawing on examples from the seminal Spiral Dynamics work "Spiral Dynamics: Mastering Values, Leadership, and Change” strengthens the interpretation of the correlations and relates the statistical findings to real-world manifestations of the vMEME value systems.
The correlations between the reasons for abandoning goals and Spiral Dynamics stages reveal insights about the motivations and perspectives of each vMEME.
For example, the Red stage's positive correlation with "feel the world owes them something" reflects their core driving force being power and control, as described in the book. Reds seek glory, respect, prestige, and entitlements from the world. When these are not forthcoming, Reds are more prone to give up on goals and feel victimized, as the correlation indicates.
The positive Purple correlation with "feel they have something to lose" is supported by the book's depiction of Purples as valuing safety, security, and group inclusion. When goals threaten to take away something they value or disrupt group stability, Purples are more likely to abandon the goals to preserve what they have, as the correlation suggests.
The negative Blue correlation with "see failure as the signal to turn back" aligns with the book's description of sacrifice and redemption being core Blue values. This finding indicates Blues will view failure as a test of faith and a sign to try harder rather than give up, fitting their internal framework.
The positive Yellow correlation with "see failure as the signal to turn back" reflects Yellows' integrative worldview. The book describes their ability to extract lessons and reframe failure with an adaptive approach. This supports the correlation linking Yellows with course-correcting rather than abandoning goals after failures.
Applying the Insights
The correlations between the reasons for abandoning goals and Spiral Dynamics stages provide targeted insights that can be applied to help improve perseverance. Practical recommendations include:
Individuals:
- Purples who correlate with "fear losing something" may persist by emphasizing how the goal aligns with group values. Example: a change initiative is positioned as improving practices to benefit the whole team.
- Reds who correlate with "fear failure" could set smaller milestones to gain confidence in achieving success. Example: someone launching a startup splits the goal into funding, prototyping, and customer acquisition stages.
- Blues correlating with persistence despite failure could frame goals around service and significance. Example: A doctor continues pursuing a vaccine despite setbacks because it will save lives.
- Oranges less fearful of the future could set stretch visionary goals. Example: An entrepreneur starts a company aimed at colonizing Mars.
- Yellows who adapt goals based on failure could conduct iterative experiments. Example: A scientist tweaks hypotheses based on results rather than abandoning a research line.
- Greens who negatively correlate with "give up power" may be motivated by aligning goals to their identity. Example: an activist persists in policy reform goals tied to their values.
Organizations:
- Give Purples time to process changes and provide group support. Example: town halls to discuss impacts of new initiatives on the organization.
- Offer Reds achievable challenges to build competencies and counter fear of failure. Example: sales contests with tiered attainable goals.
- Offer Blues opportunities to connect goals to meaning and purpose. Example: Healthcare workers are shown how improved processes impact patient outcomes.
- Give Oranges autonomy to set bold goals and take risks. Example: R&D teams are empowered to prototype innovative ideas without fear of failure rapidly.
- Ensure Greens have autonomy over goals supporting self-actualization. Example: discretion over projects tied to causes they are passionate about.
- EncourageYellows to share lessons learned across teams and adjust goals. Example: Technology company holds failure parties to pivot based on prototypes that didn't work.
These examples demonstrate how individuals can be motivated by matching goals to their Spiral traits. Organizations can also increase buy-in and achievement by appealing to different value systems.
Conclusion
This analysis of goal abandonment reasons correlated with Spiral Dynamics stages yielded several key insights:
- Reasons people give up are linked to psychological value systems. Reds correlate with entitlement and fear of failure. Purples correlate with fear of instability. Blues persist despite setbacks.
- Tailored strategies can target root causes based on someone's Spiral orientation. Matching goals to motivations and worldviews improves persistence.
- Organizations can motivate achievement by appealing to different Spiral perspectives. Enable teams based on value systems.
While this exploration uncovered meaningful relationships, larger datasets could reveal more nuanced patterns. Additional research should replicate and expand upon these findings across broader demographics. Extending the correlation analysis to other goal achievement factors could also provide a fuller picture.
Using Spiral Dynamics to Understand Goal Abandonment and Improve Goal Persistence:
- Understanding the reasons for giving up from a Spiral Dynamics perspective can help individuals and organizations develop tailored strategies to address these reasons.
- For example, individuals at the Red stage may benefit from reframing their mindset to focus on growth and learning rather than feeling sorry for themselves or assuming their problems are unique.
- Organizations can also use Spiral Dynamics to design interventions tailored to their employees' developmental stage, such as leadership development programs designed to meet the needs of individuals at different stages of the Spiral.
- By understanding individuals' and groups' underlying motivations and values, Spiral Dynamics can be a powerful tool for improving goal persistence and achieving success.
Examples:
- An individual at the Red stage struggling to persist in their goals may benefit from working with a coach or therapist who can help them reframe their mindset and develop a growth-oriented perspective.
- An organization that is struggling with high turnover rates may benefit from using Spiral Dynamics to design a leadership development program that is tailored to the developmental stage of their employees, such as a program that focuses on developing the leadership skills of individuals at the Green stage who may be more likely to give up their power.
- A team that is struggling to achieve their goals may benefit from using Spiral Dynamics to identify the underlying reasons for their lack of progress and develop tailored strategies to address these reasons, such as providing additional support and resources for individuals at the Purple stage who may be more likely to give up when they feel they have something to lose.
In conclusion, this psychographic approach demonstrates the power of frameworks like Spiral Dynamics. Understanding human motivations through the lens of developmental levels enables customized solutions. With more validated insights, we can move beyond one-size-fits-all interventions to help individuals and organizations accomplish their most meaningful goals.
[1] https://twitter.com/annavitals
[2] https://linkedin.com/in/annavital
[3] https://facebook.com/annavital.official
[4] https://adioma.com
[5] https://facebook.com/annavitals/posts/pfbid0L9YdgdDmTG4DCGjxQ7j5NcibjJBTVbZsc6kvTN7tCrvZNC3oL8yJpb9JVGjMd231l
2023.08.27
FearpersonqualitiesprojectorganizationalstructureRACIresponsibilitymatrixCritical ChainProject Managementfocus factorJiraempathyleadersbossGermanyChinaPolicyUkraineRussiawarvolatilityuncertaintycomplexityambiguityVUCArelocatejobproblemcountryreasongive upobjectivekeyresultmathematicalpsychologyMBTIHR metricsstandardDEIcorrelationriskscoringmodelGame TheoryPrisoner's Dilemma
Valerii Kosenko
제품 소유자 SaaS SDTEST®
Valerii는 1993년에 사회 교육자-심리학자 자격을 취득한 이후 자신의 지식을 프로젝트 관리에 적용해 왔습니다.
Valerii는 2013년에 석사 학위와 프로젝트 및 프로그램 관리자 자격을 취득했습니다. 석사 과정 동안 그는 프로젝트 로드맵(GPM Deutsche Gesellschaft für Projektmanagement e. V.)과 Spiral Dynamics에 익숙해졌습니다.
Valerii는 V.U.C.A.의 불확실성을 탐구한 저자입니다. 나선형 역학과 심리학의 수학적 통계를 이용한 개념, 38개의 국제 여론 조사.

 0,0763